
Why the combination “volumes + levels”?
With fifteen years of trading experience behind me, I learned how to make money on trading in many ways. And perhaps the simplest way is to find large sharks in the market and just follow them.
Indeed, this is the simplest type of market analysis, and the easiest way for both beginners and professional traders to make money on the market. This trading strategy is as simple as the AK-47, anyone can probably master it if they apply enough strength and patience.
And the basis of the strategy is the analysis of levels and volumes. In general, a classic ways of analysis. The only exception is that instead of the usual volumes used by the majority, we will only look at significant volumes.
So, here is one of the most reliable and simple trading strategies, tested over the years and many traders who successfully use it to this day. So share the link to this guide with your friends, and study it yourself.
Analysis Based On Trading Volumes
Anyone who uses even advanced market analysis systems that base their calculations on publicly available data runs the risk of thinking like most.
What volumes are available to everyone, and everyone uses them?
- First, these are tick volumes. It’s a useless thing, because in each tick, a different number of contracts is always traded. And by itself, the amount of ticks means little.
- Secondly, these are volumes from the FOREX market. It is different for each broker. FOREX is not a centralized exchange.
- Thirdly, the trading volumes of futures contracts. This is more important information, because it gives us an idea of the market, allows us to build clusters, Market Profile and much more. But since most traders rely on these volumes, in the end they are of little help for analysis.
What Can Be Used In Such A Case To Gain Trading Advantages?
- Hidden volumes, icebergs, volumes of HFT robots. This is something that we do not see in the order book on the market, but something that strongly influences price movements. There are various ways to uncover hidden sellers and buyers in the market using order book analysis or the Time And Sales price feed.
- Volumes based on the COT database. The Commodity Futures Trading Commission (CFTC) publishes weekly statistics on the transactions of major players in the market. This is very useful and interesting data that gives an answer to the question of who is the owner of the market now, and who is buying the market and who is selling it. For example, if we see that oil has been flat for several months, it is very difficult to understand what is happening in the market if you use publicly available volume data. But if you analyze the COT reports and you see big players taking short positions on oil futures while speculators and small players are buying it, it gives more insight to analyze further price movements.
- Significant volumes in the market. Using the Wall Street Trader Pro indicator, you can see only those volumes that significantly affect the market. They usually help us understand what a major player is doing at significant points in the market. Using them, you can analyze the behavior of a major player at significant levels.
Market Analysis Using Levels And Volumes
The basis of price forecasting is to look at what a major player is doing at various price levels.
To analyze the behavior of volumes at a level, there are various approaches, such as:
- Price action. This method studies price formations, what the market does around round prices, how price behaves around “strong levels”, and how to read the behavior of a major player through the prism of price patterns.
- VSA. Volume Spread Analysis. This is a method of market analysis based on the relationship between the impact of large volumes on the price. For example, if the market grew to a certain level and then fell on a large volume, this may indicate the presence of a large player in the market who wants to see prices lower.
- Volume Profile. This is an analysis with which we analyze the balances of supply and demand in the market. For example, if the price spent most of the time in a particular range, then this means that it satisfies all market participants at the same time, and is a kind of attraction zone for traders.
- And other methods. There are a also large number of types of technical and candlestick analysis that can be used to find patterns in price movements.
I propose to dwell on the simplest approaches, namely, to analyse significant volumes, and look at what levels it appears and how the price behaves. In fact, this is the basis of market analysis!
The Simplest Pattern
To understand how this happens, I will give examples of various cases on the use of this approach. I will use forecasts based on volumes and levels, and we will see the results they led to.
One of the simplest patterns is when the price rises on volume and then falls lightly. What does it show? As a rule, this indicates that a large player has entered the market, pushing the price up, which makes it possible to say that there is a large buyer in the market.
What can we do in such a case? Place a pending buy order at the bottom of the chart in case the price drops. And then watch how a major player will defend their positions, again pushing the price up.
The same is true in reverse. Example:
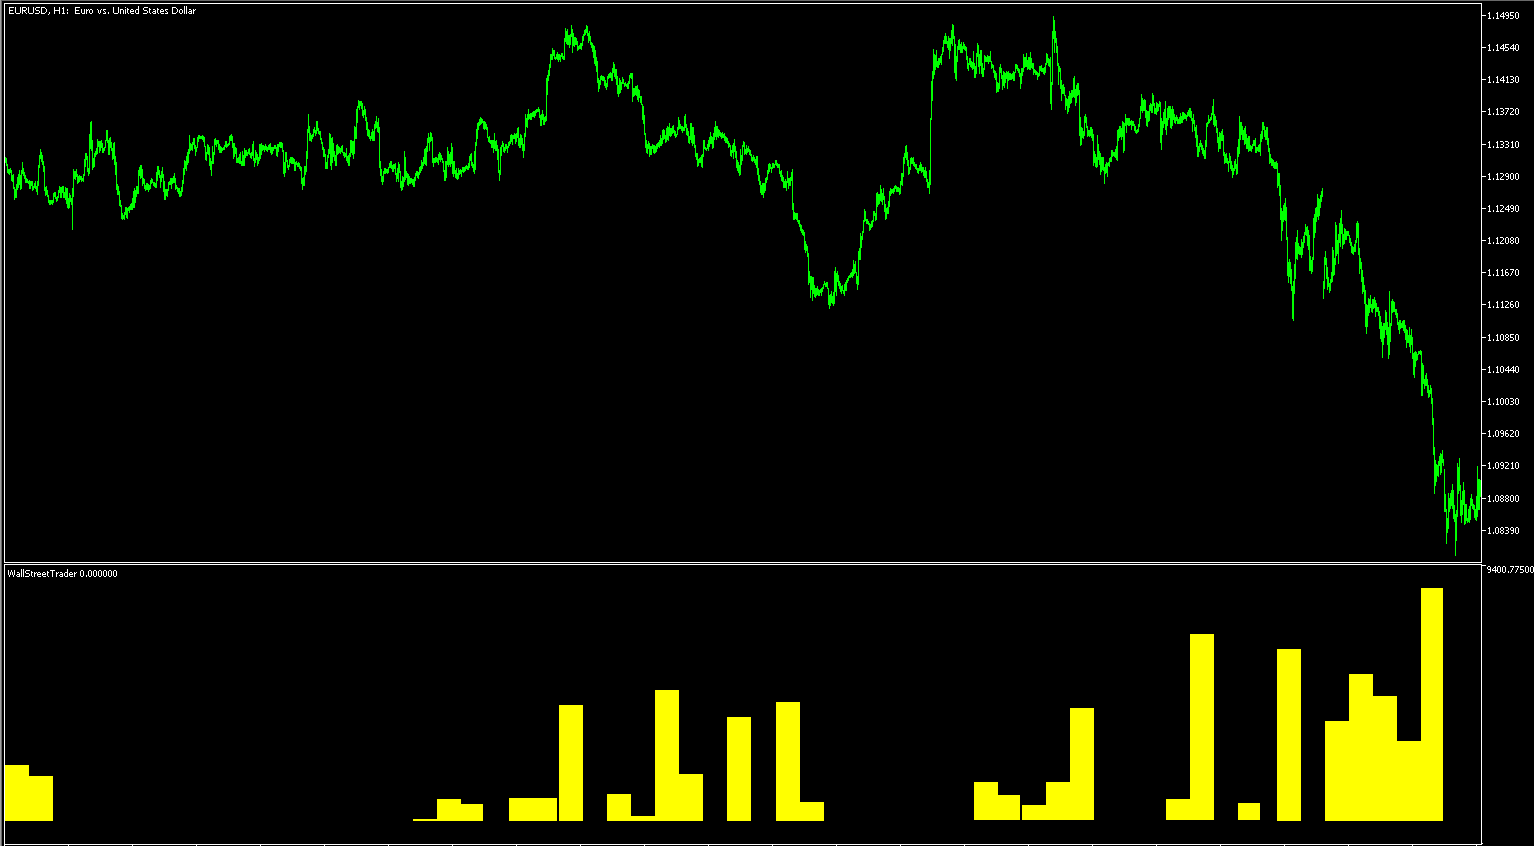
What do we see in this pic? This is the price chart. And at the bottom, we display data on significant volumes using the WallStreetTrader Pro indicator.
What do these volumes tell us? Everything is very simple, on the left of the chart we see a flat (the first zone). There were almost no volumes. Then the market starts to fall and at the bottom we see that a major player enters the market. It looks like he’s selling. And then looking at how the price grows without volume (zone 3), it becomes clear that indeed, a major player is only interested in short positions. This allows you to enter the market for sale, thereby sitting on the tail of a major player at point A1.

In addition, it is clear that the price in zone 3 could not break through the high of zone two. Which is logical if a major player is already in the market and he will not allow the price to rise higher. On the contrary, his task will now be to lower the price lower, which we see in the fourth zone, where as the price falls, a major player enters with even greater volume, pushing the price down. Which suggests that his total market deal has become even larger, and this will lead to an even greater drop in the market.
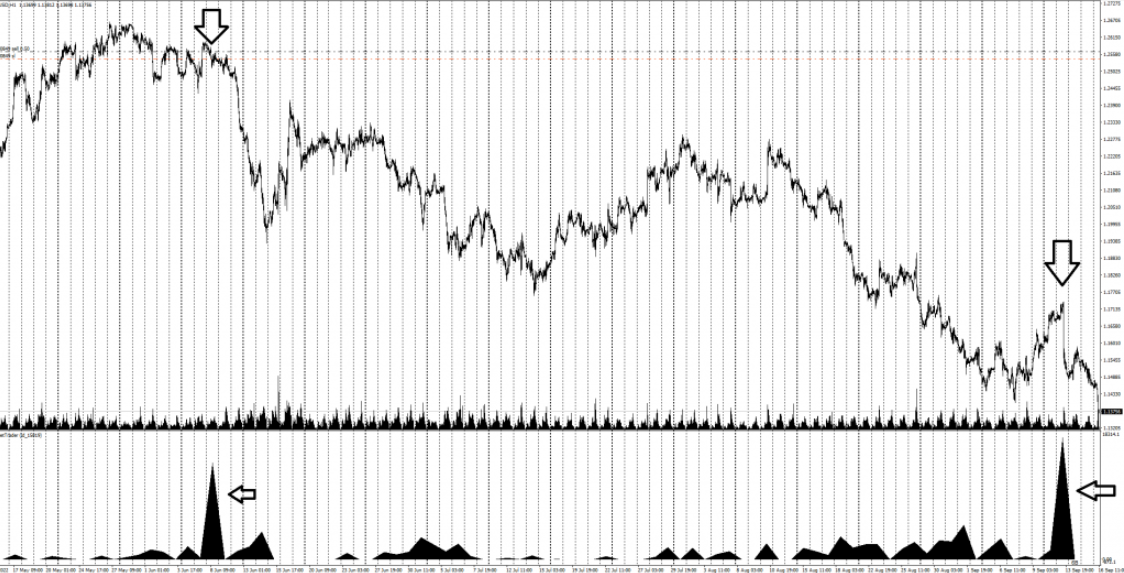
Example. GBPUSD dated July 28, 2020.
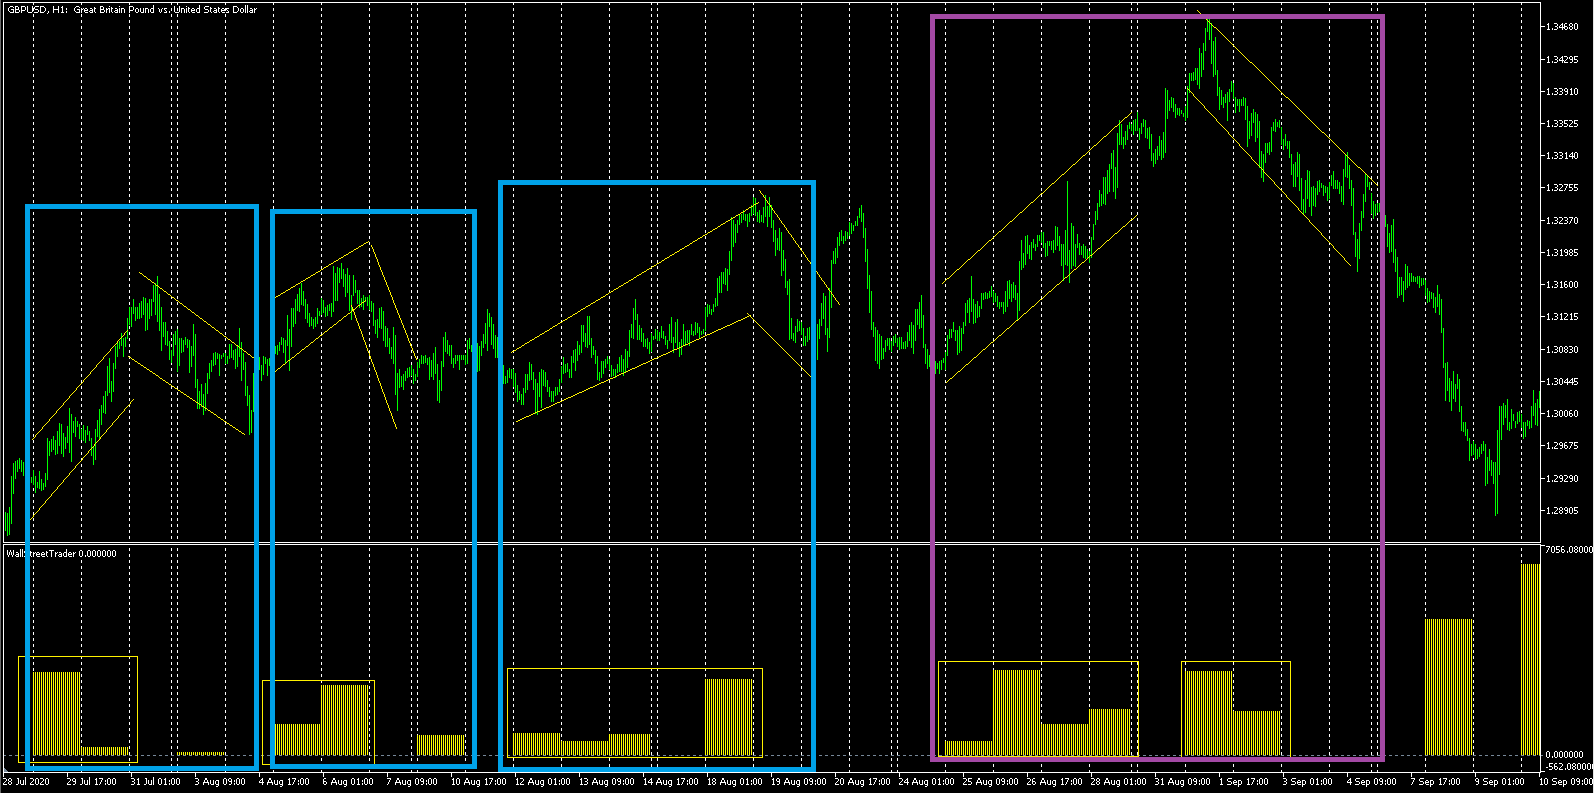
Here you see on the left side three such patterns, when the price grew on volumes, and fell lightly. This made it possible to consider that the trend was increasing.
On the right side of the chart, we see that the price was also falling on volumes, which means that a major player has begun to enter the sale, so the trend is no longer growing.
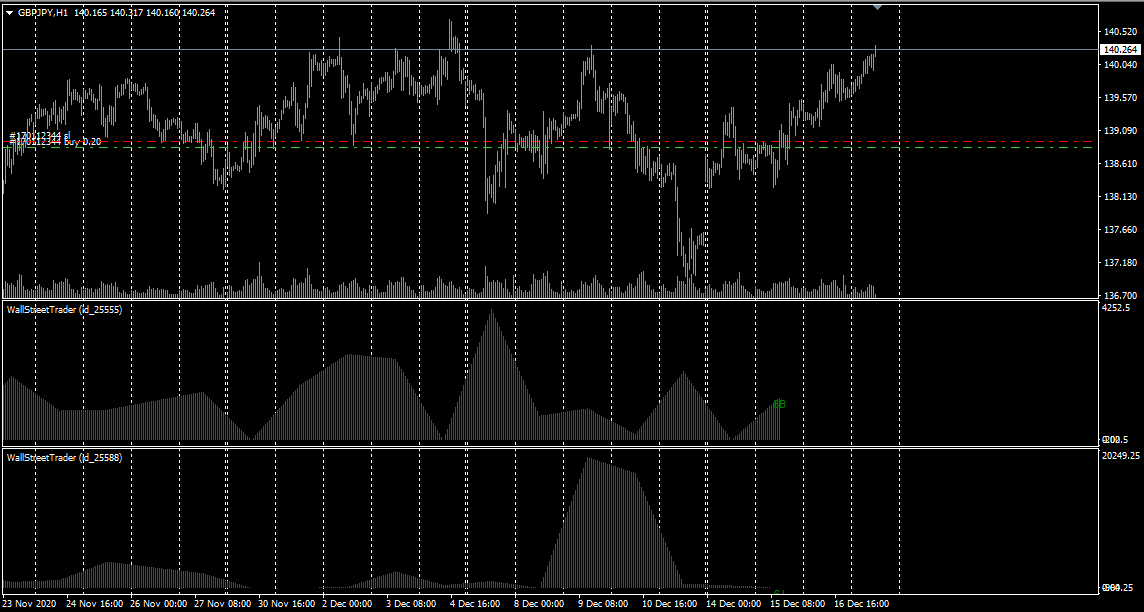
Example. Japanese yen. December 2020.
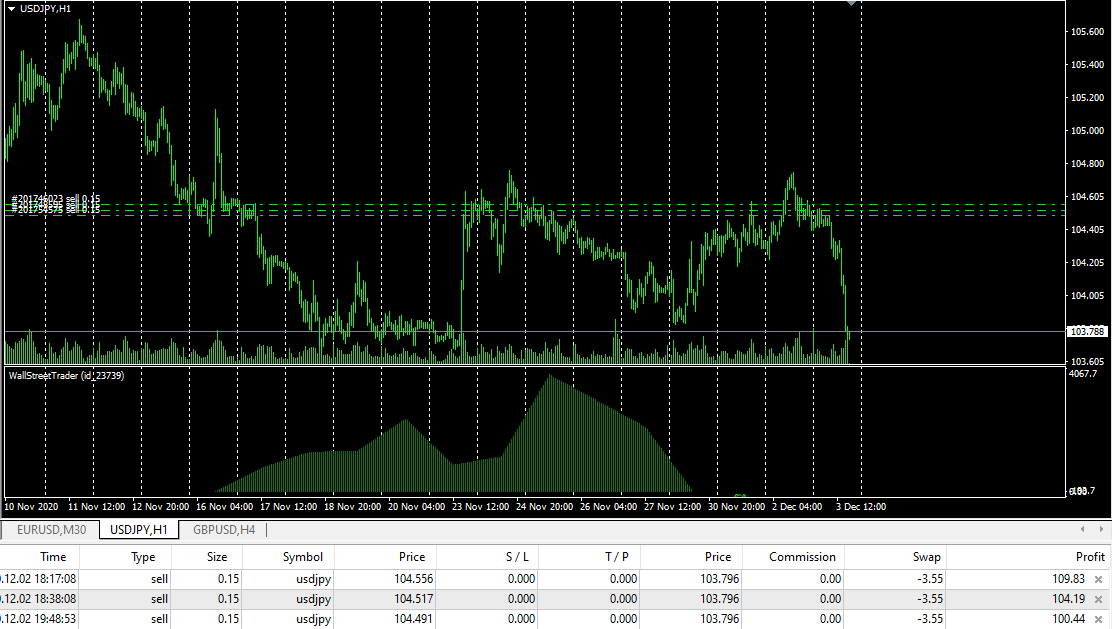
What do we see in this chart?
Starting November 24, we have large volumes (below) that do not stop until November 28. This shows that a major player is entering on a dip in the market. Conversely, during the growth of the market from November 28 to December 2, there are no injections of volume. A major player does not want to enter on growth, which indicates that the trend is down, and at the level of the beginning of large sales, you can enter the sale again.

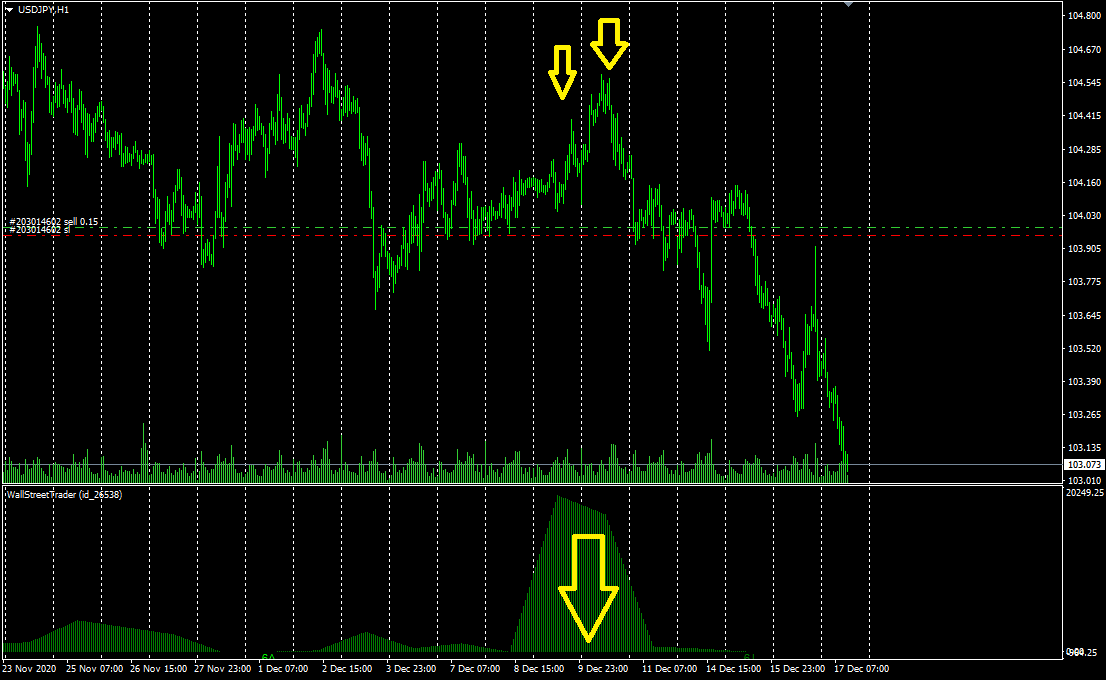
In the future, the price returned to the top again, but since the trend has not changed, there was nothing to fear. Moreover, the price rose again without volume, and at the level above we saw two more days of protective volume:

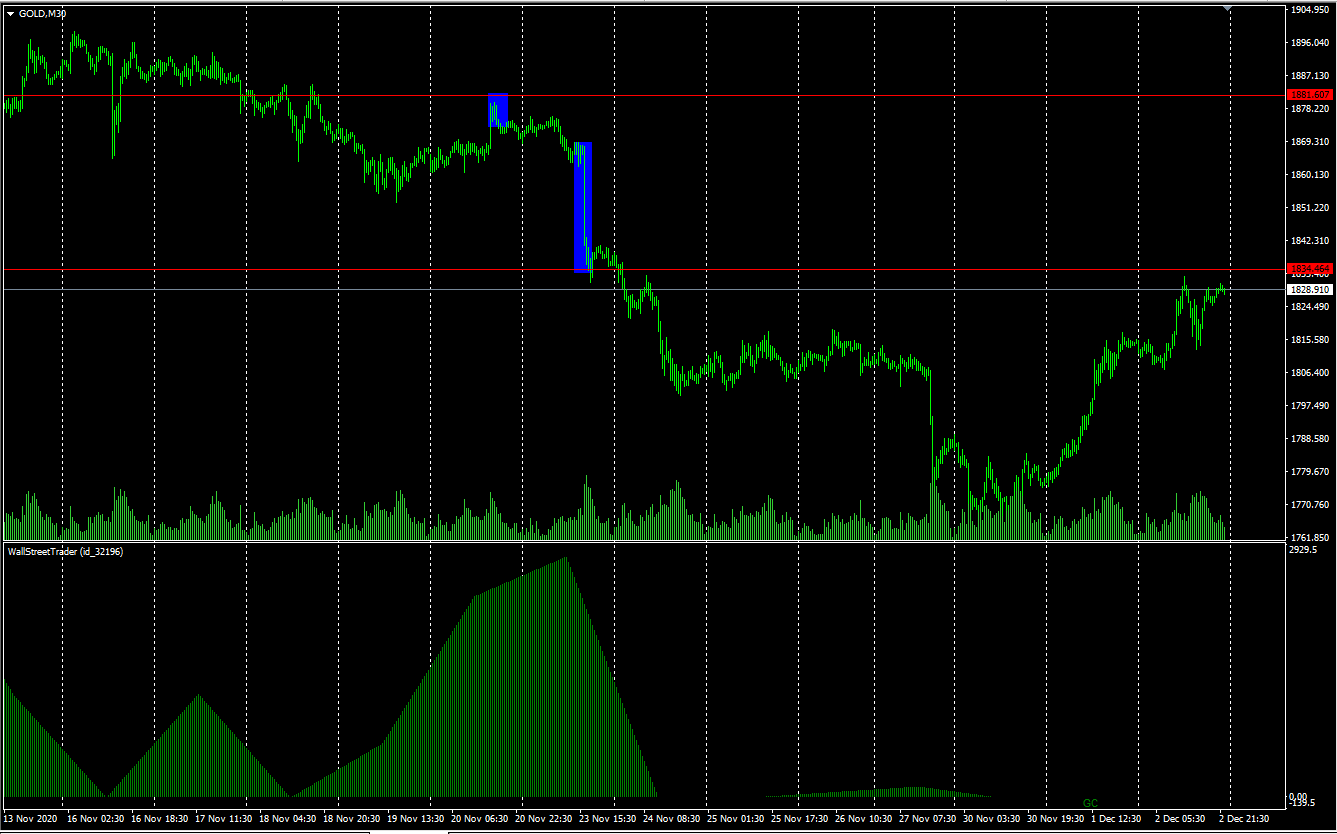
Example. Gold. December 10, 2020.
Also, to analyze volumes in difficult situations, you can take a look at smaller timeframes to see where the main trading volumes were concentrated during the day. This is useful in cases where the price both rose and fell during the day.
In this case, you can see where it moved without volumes, and where – with them. After all, if the WST Pro indicator shows significant intraday volumes, then it would be logical to assume that they will be in those places where the price was trading at the maximum volumes of traded futures contracts.
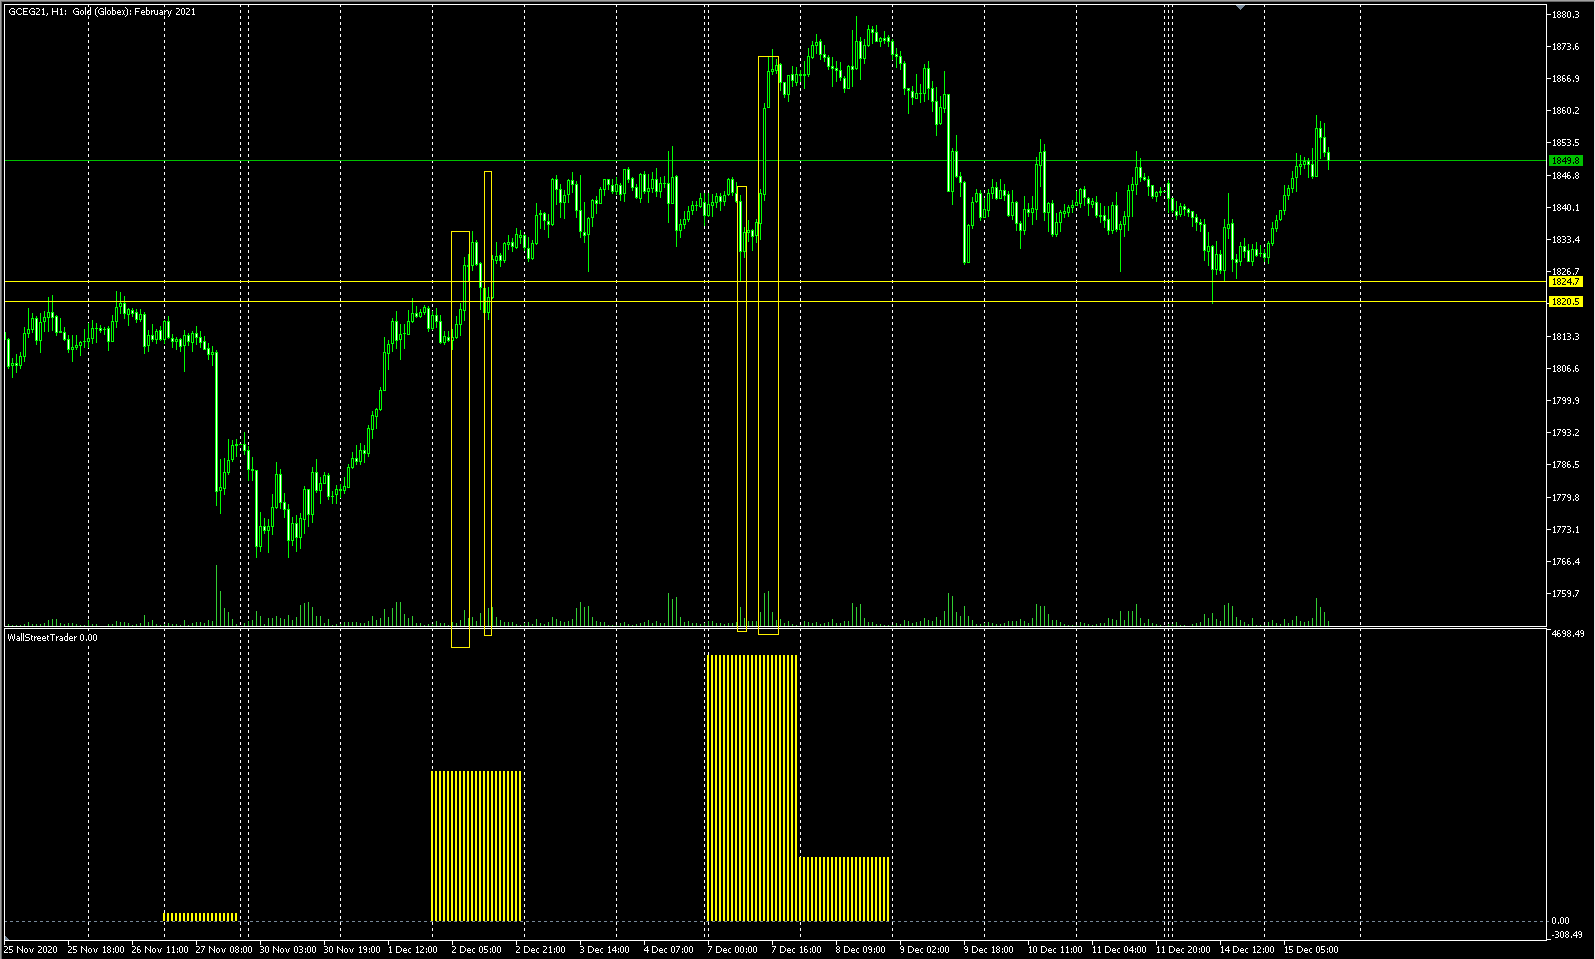
In this case, it becomes clear that the volumes on the price increase were high, so the general upward trend is clear.
Subsequently, gold rose.
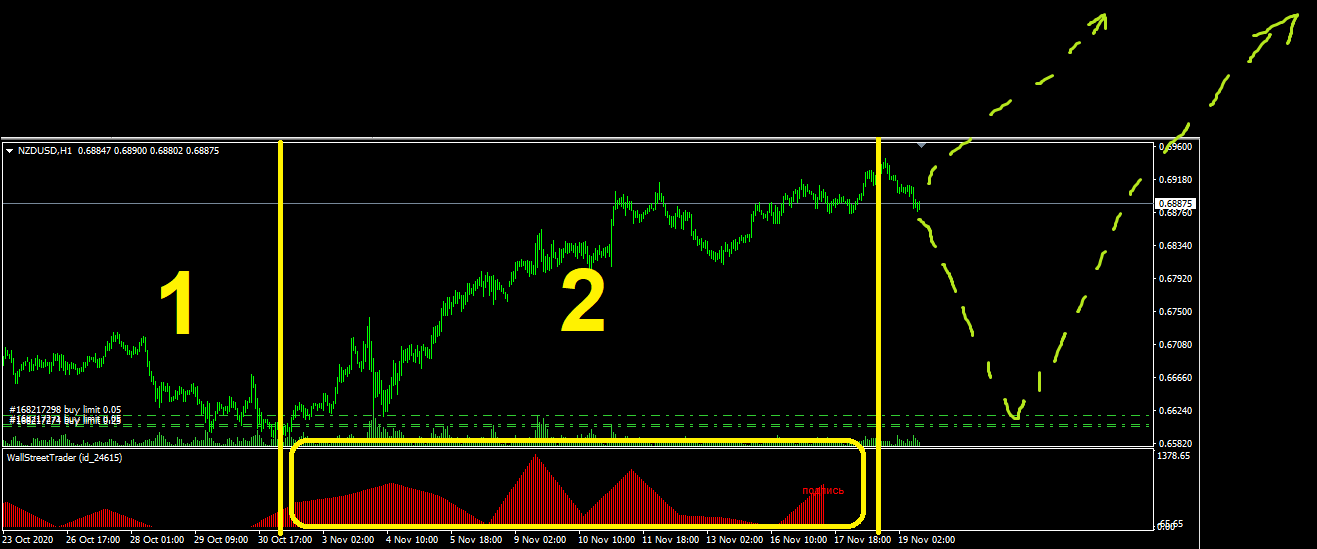
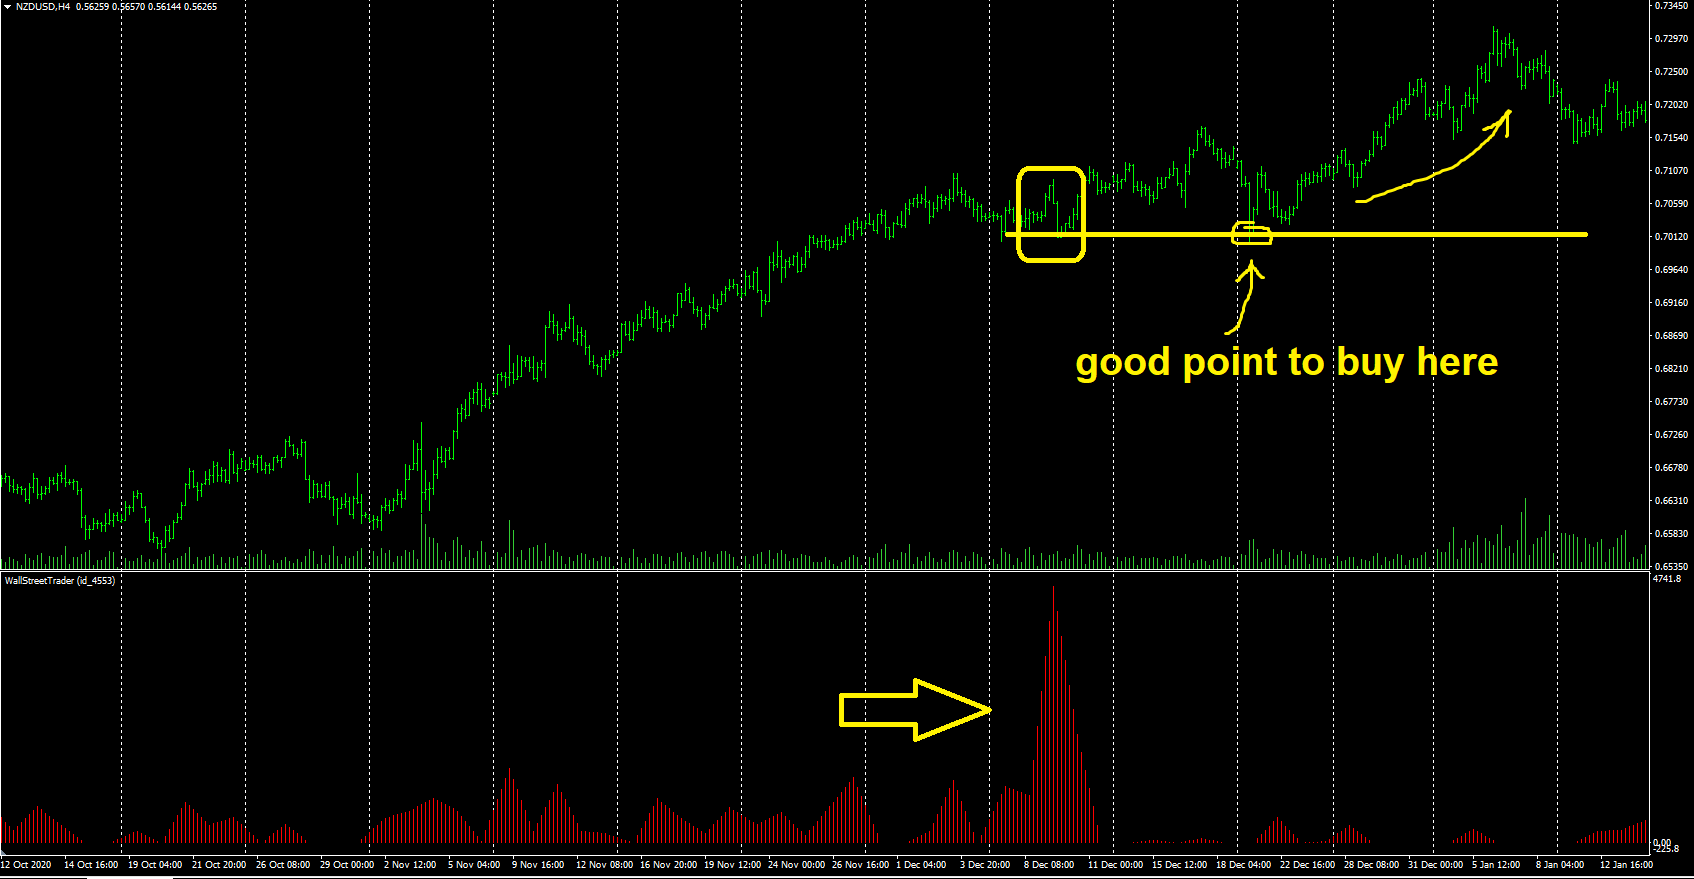
Example. New Zealand dollar. November 20, 2020.
The price rises after the flat, and we see the appearance of significant volumes from the very beginning of the price increase. In this case, if it falls below, we will be able to “sit on the neck” of a major player, and earn a profit when the price goes up further.
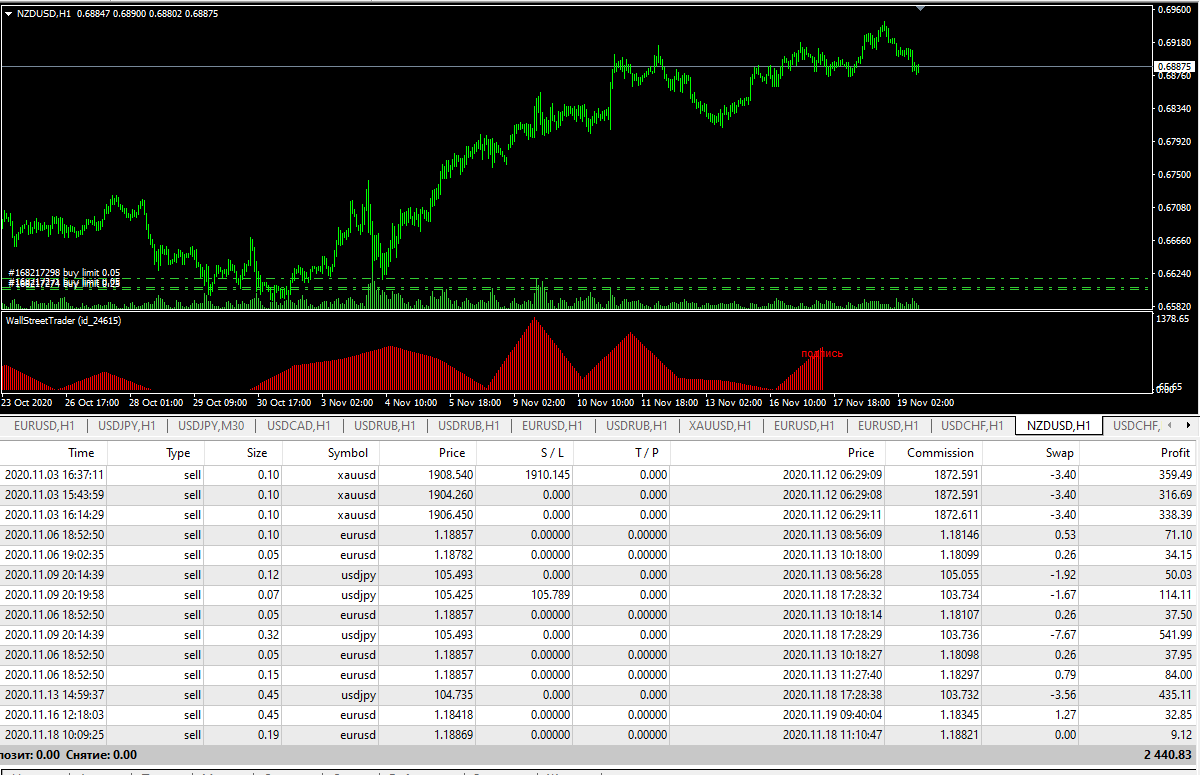
Here on the first segment we see a flat. And volumes appear on the second section below.
Further price movement is obviously upward, or the price may drop down before the big players start buying, and then go up anyway:
Unfortunately, the price after that grew without a recoil, it was not possible to enter the market:
However, later a major player entered the market even stronger, and already from these large purchases it was possible to enter the market on a rollback. These injections into the market coincided with the beginning of the period of liquidity on the new futures contract. Usually it happens like this – a major player opens positions at the beginning or in the middle of a liquid contract, then drives the price up, for example, and fixes positions before closing the contract, gaining profits. Then everything is repeated on a new contract. Some of the positions, however, remain if a major player has opened deals on the spot market.
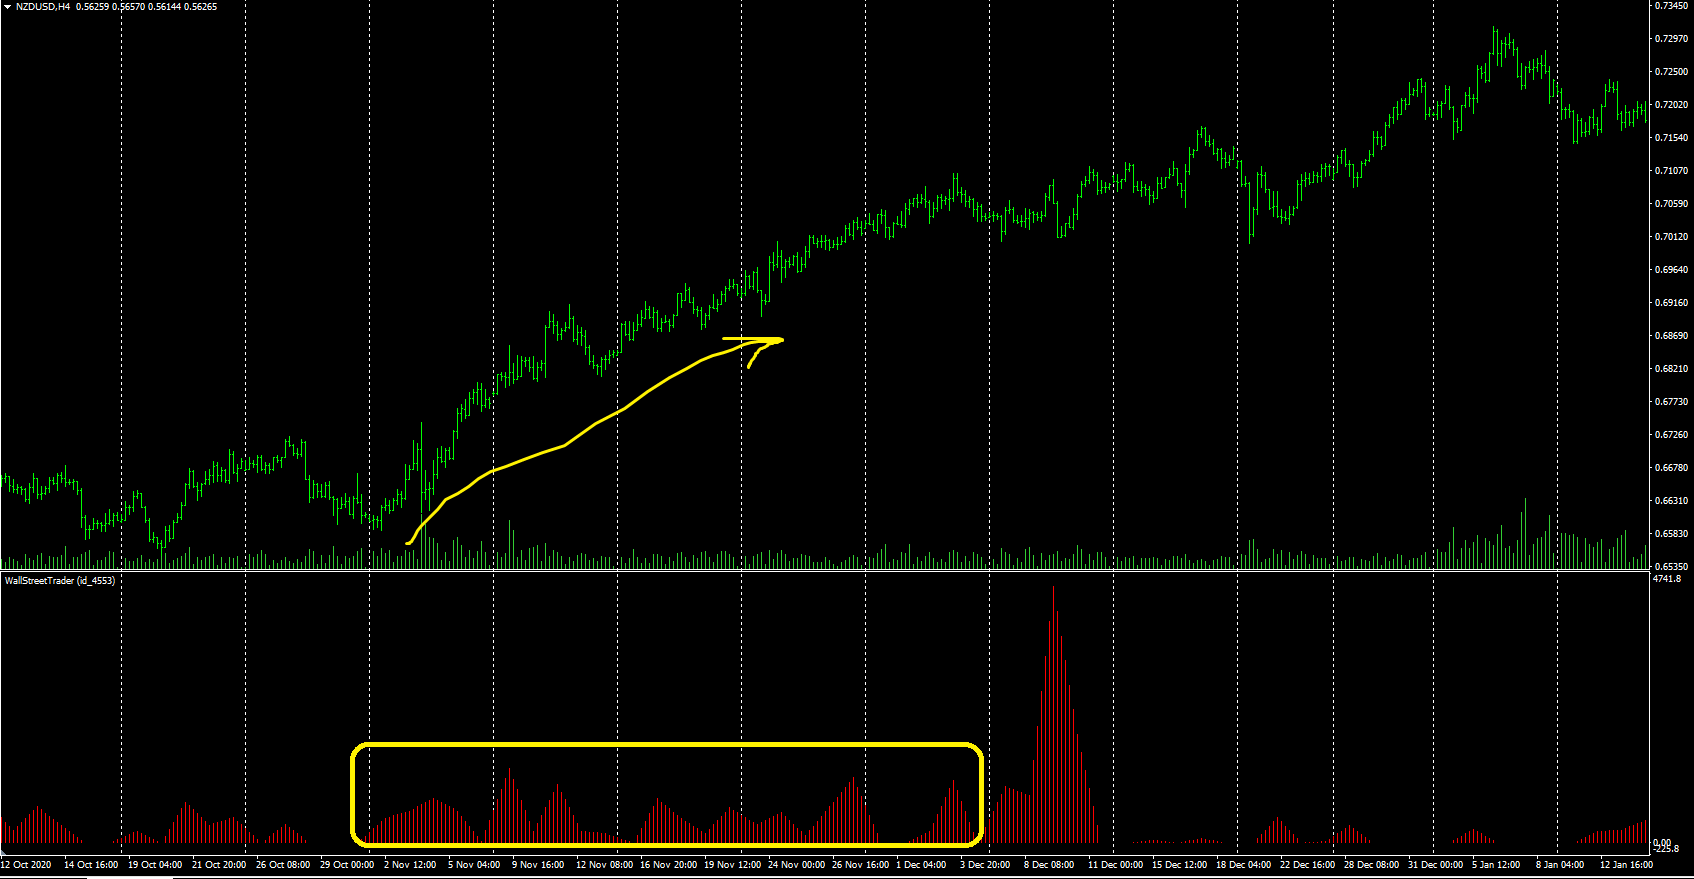
In this case, a major player also entered the market following the trend, and then, on the price rollback, it was possible to enter with him and ride up the trend:
Example. Swiss franc dated November 1, 2020.
Here we consider the inverted formation of the pattern. Let’s take USDCHF as an example.
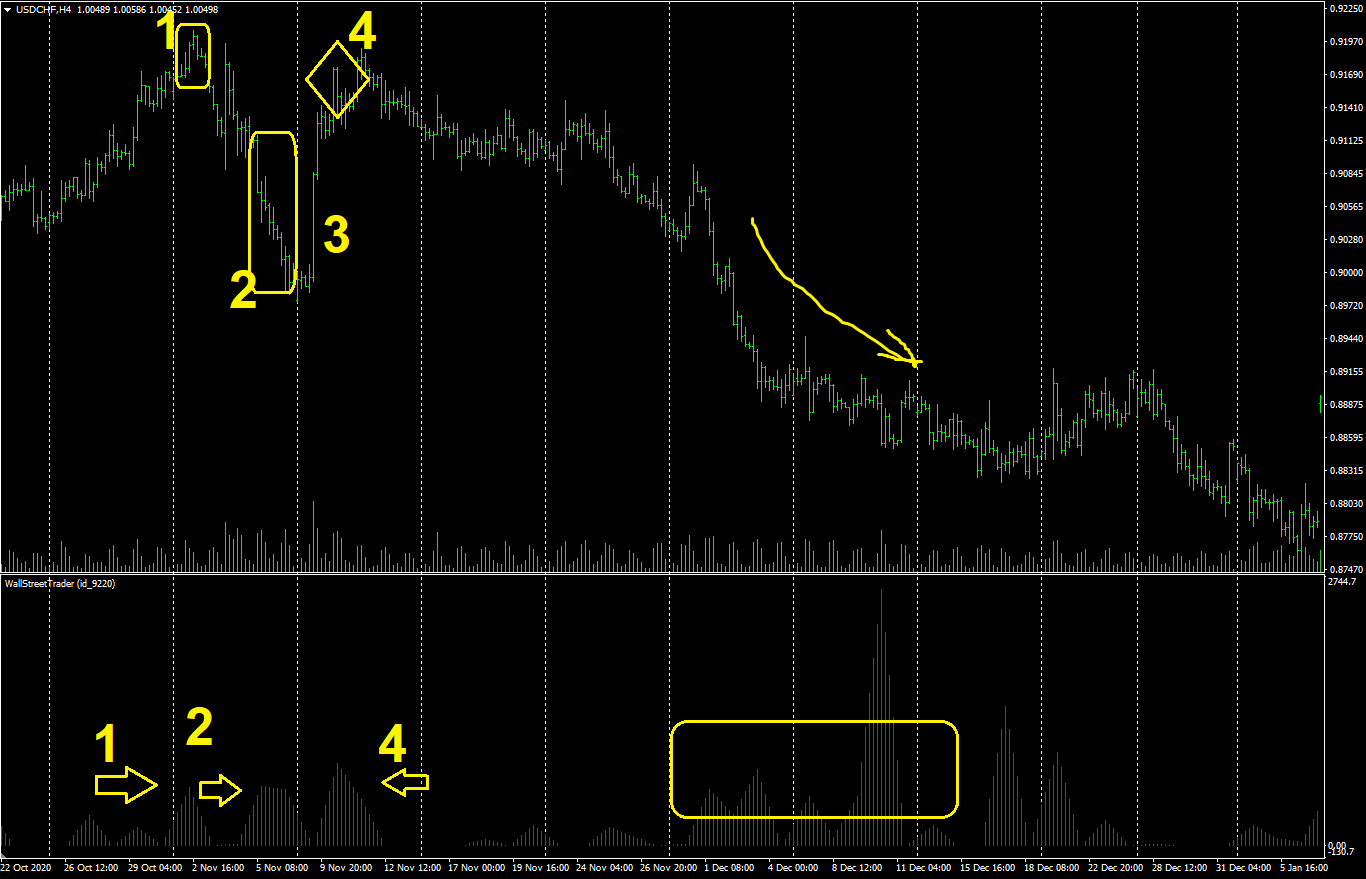
Here we see on the left side of the chart how significant volumes appear on the fall of the price. These are points 1 and 2. Then we see the growth of the market (point 3), which is not accompanied by volume. And at point 4, we see again the appearance of volumes, which tells us that a large player is obviously entering short positions again. After that, the market falls, and in the second part of the chart, you can see that then a large player enters the market even more, after which the market falls even more (you can look at the history of this period).
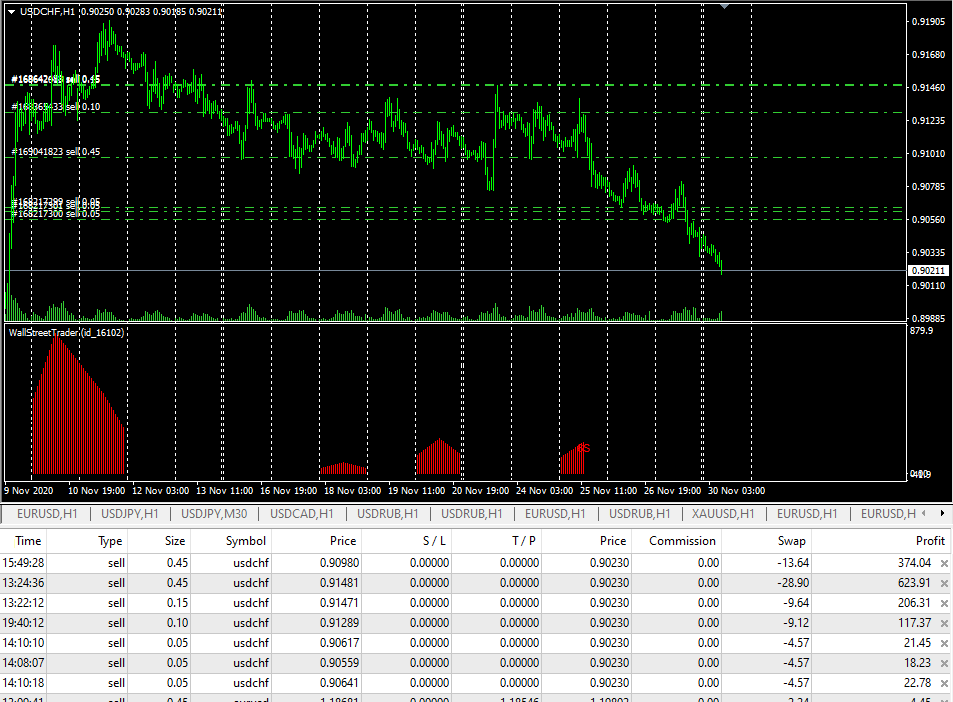
In this case, you can enter trades on the trend, even when you are already in the market:
What Other Formations Are There In The Market
Certainly, you need to analyze the market as a whole. Often there are other price patterns when a major player enters the market in a flat. And keeps any level by it’s volumes. And by analyzing his actions around this level, you can draw the right conclusions about his positioning.
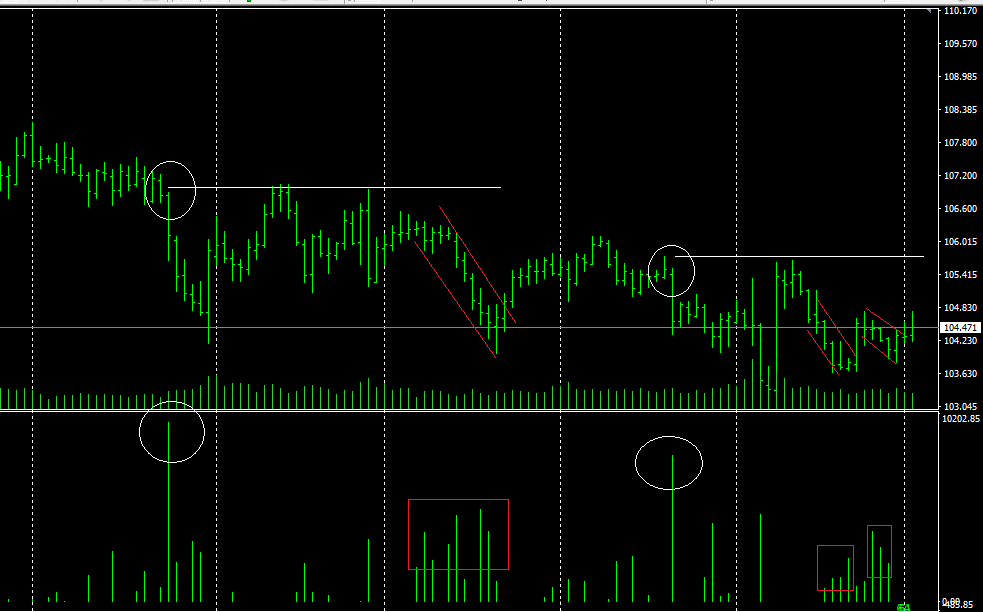
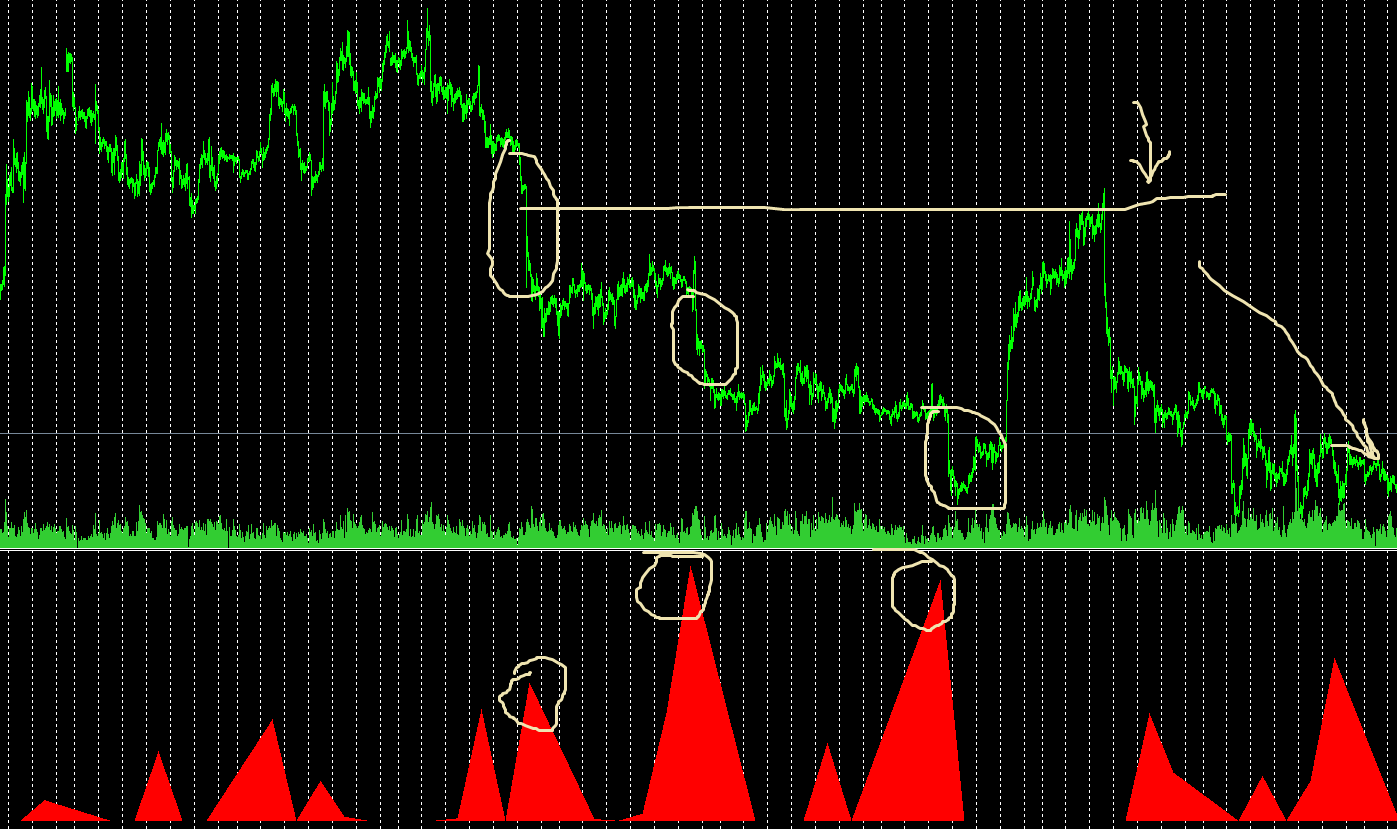
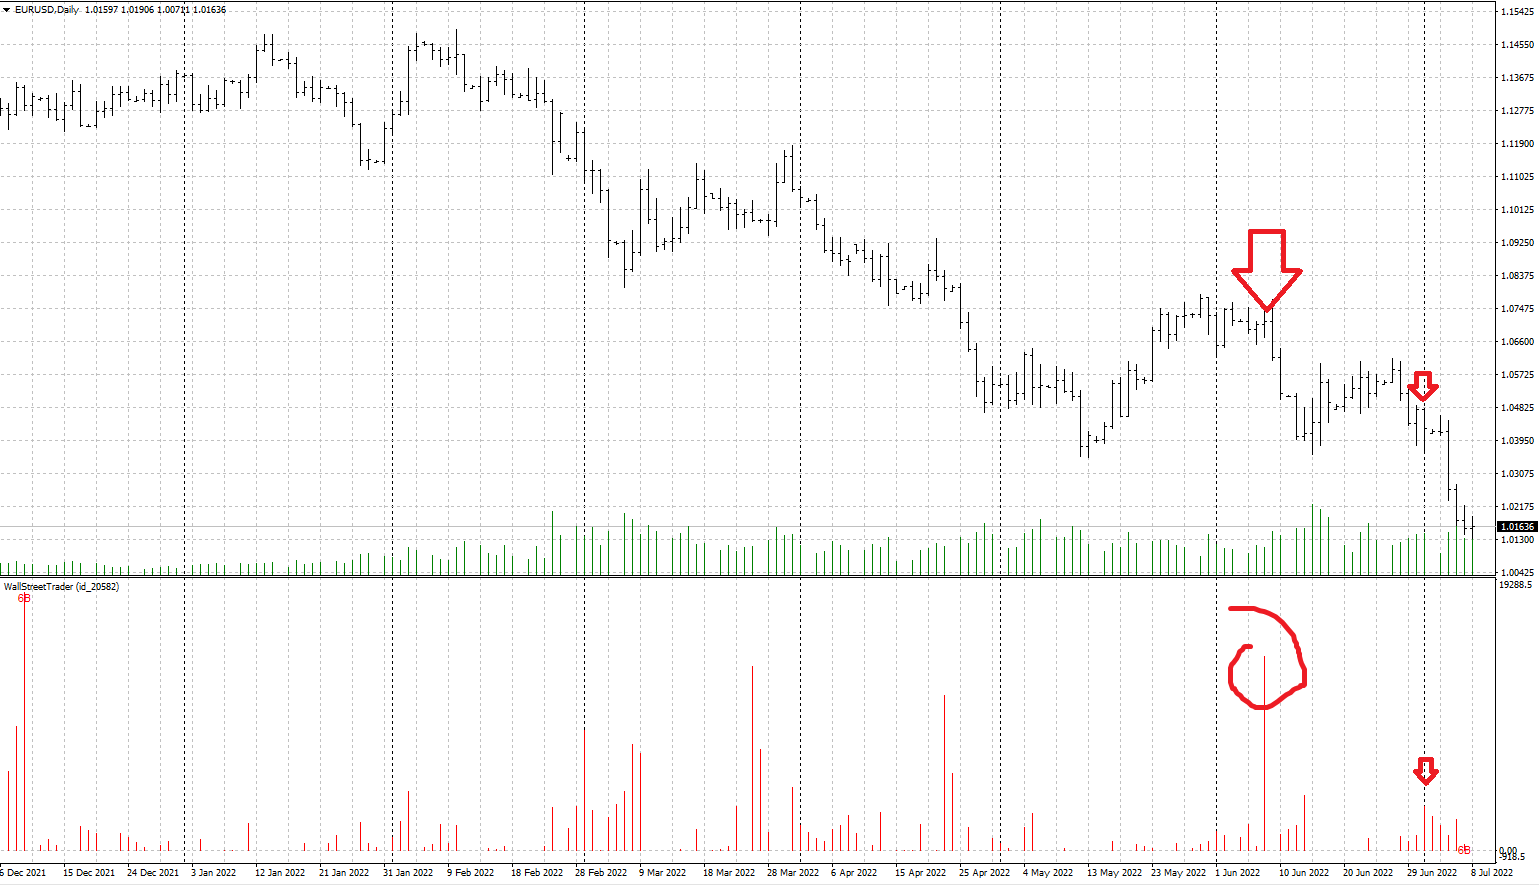
Example. Gold. December 2, 2020.
Look at the gold chart below. What do we see here?
First of all, in places of large volumes (the first ball), the price fell from the level of 107.00 – this indicates a certain beginning of a downtrend.
And when the following volumes come to the market (the first red square from the bottom), they also appear on the fall of the market. The downtrend is confirmed, and it becomes clear that if the price grows after that, then it will be possible to enter the sale.
The next large volume of significant volumes (the second white ball) indicates that a major player continues to go short. And all subsequent infusions of volumes also speak of this. Well, here it is easy to understand that gold will only fall further, and you can open short positions:
For market analysis, I recommend using the Daily and Hourly timeframes. It is easier to see where the volumes appeared on them:
As you can see, there were two days with large volumes in the picture above, these were November 20 and 23 (Friday and Monday in the market). And it is clear that on Friday the price rested from above, and a large volume appeared, which indicates protective orders of a major player from above. And this is confirmed already on Monday, the next large volume appears on the fall. All this ultimately indicates that the trend in the market is down.
Overall Market Analysis
In order to avoid such situations when the market leaves without us, we must always analyze the market as a whole, i.e. analyze each trading instrument in the aggregate, then the general trends for the near future will be clear. After all, it usually happens that a major player buys dollars, and as a result, sells most other currencies.
For example, September-October 2022 was marked by the fact that large players prefer the dollar and sell almost everything against it. Including stock indices, and even bitcoin.
Knowing how to see the whole picture, you can enter the market, even if it rises or falls without recoil, if we see that there is any currency pair that is lagging behind everyone.
There are also various indicators that help to display several trading instruments on the chart at once.
Download Overlay Chart indicator for MT4.
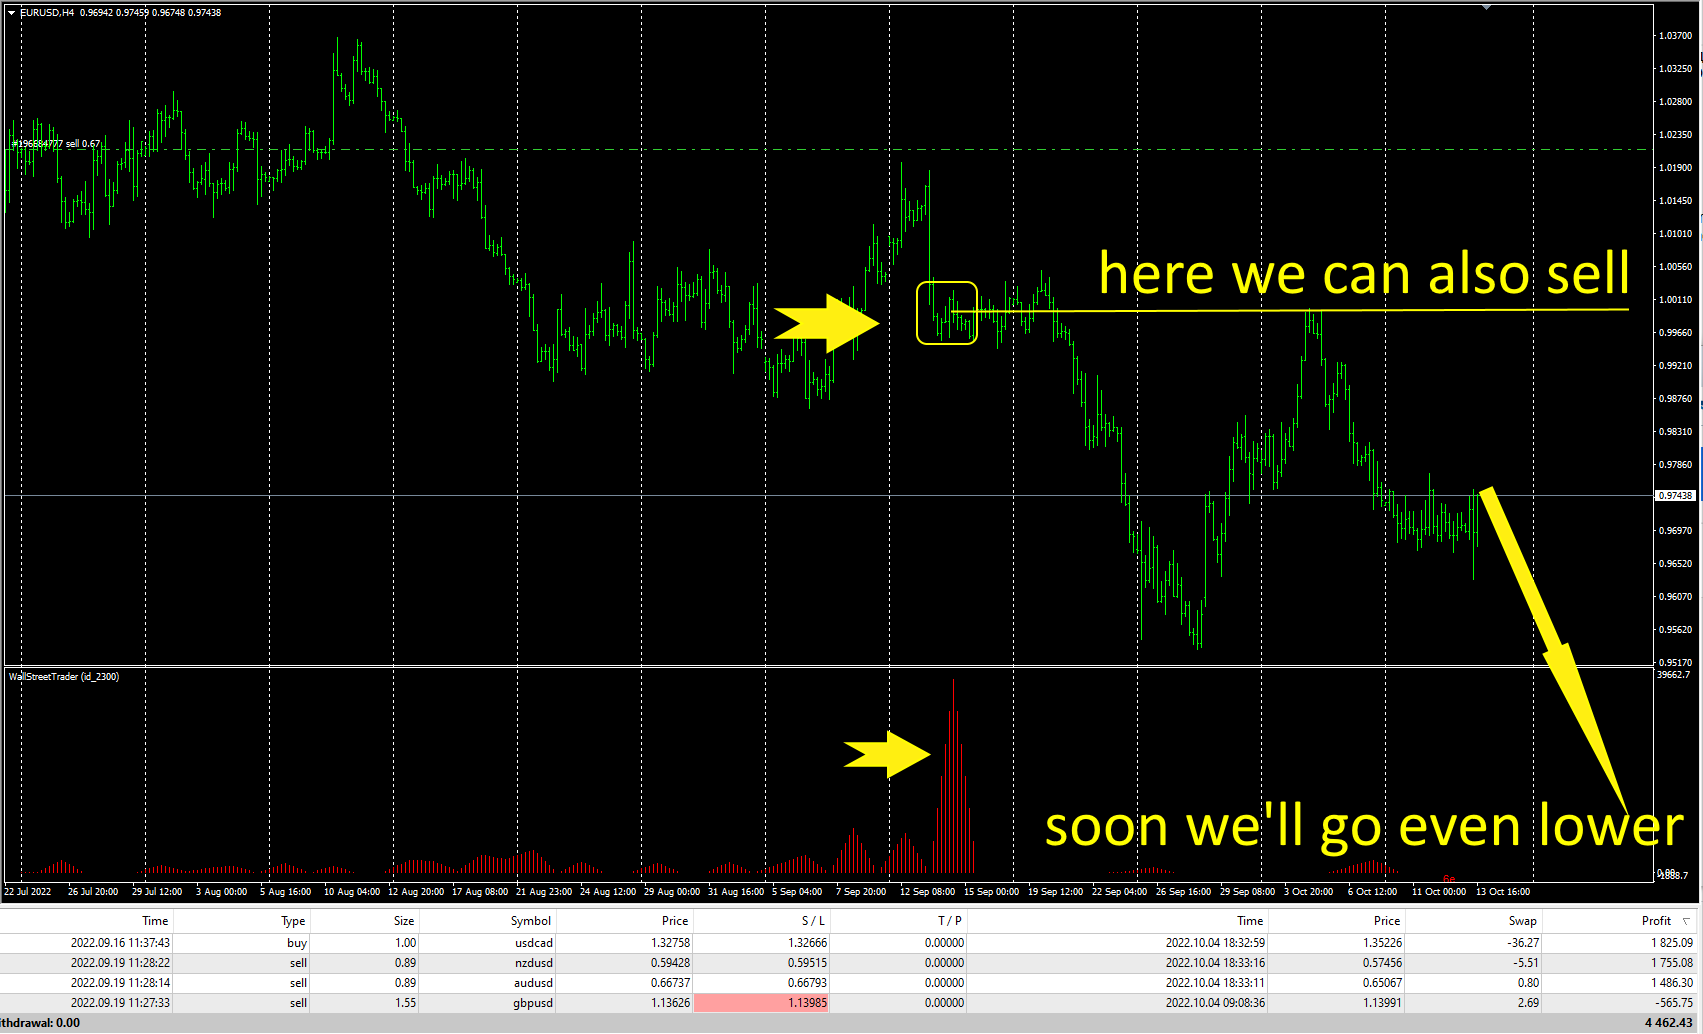
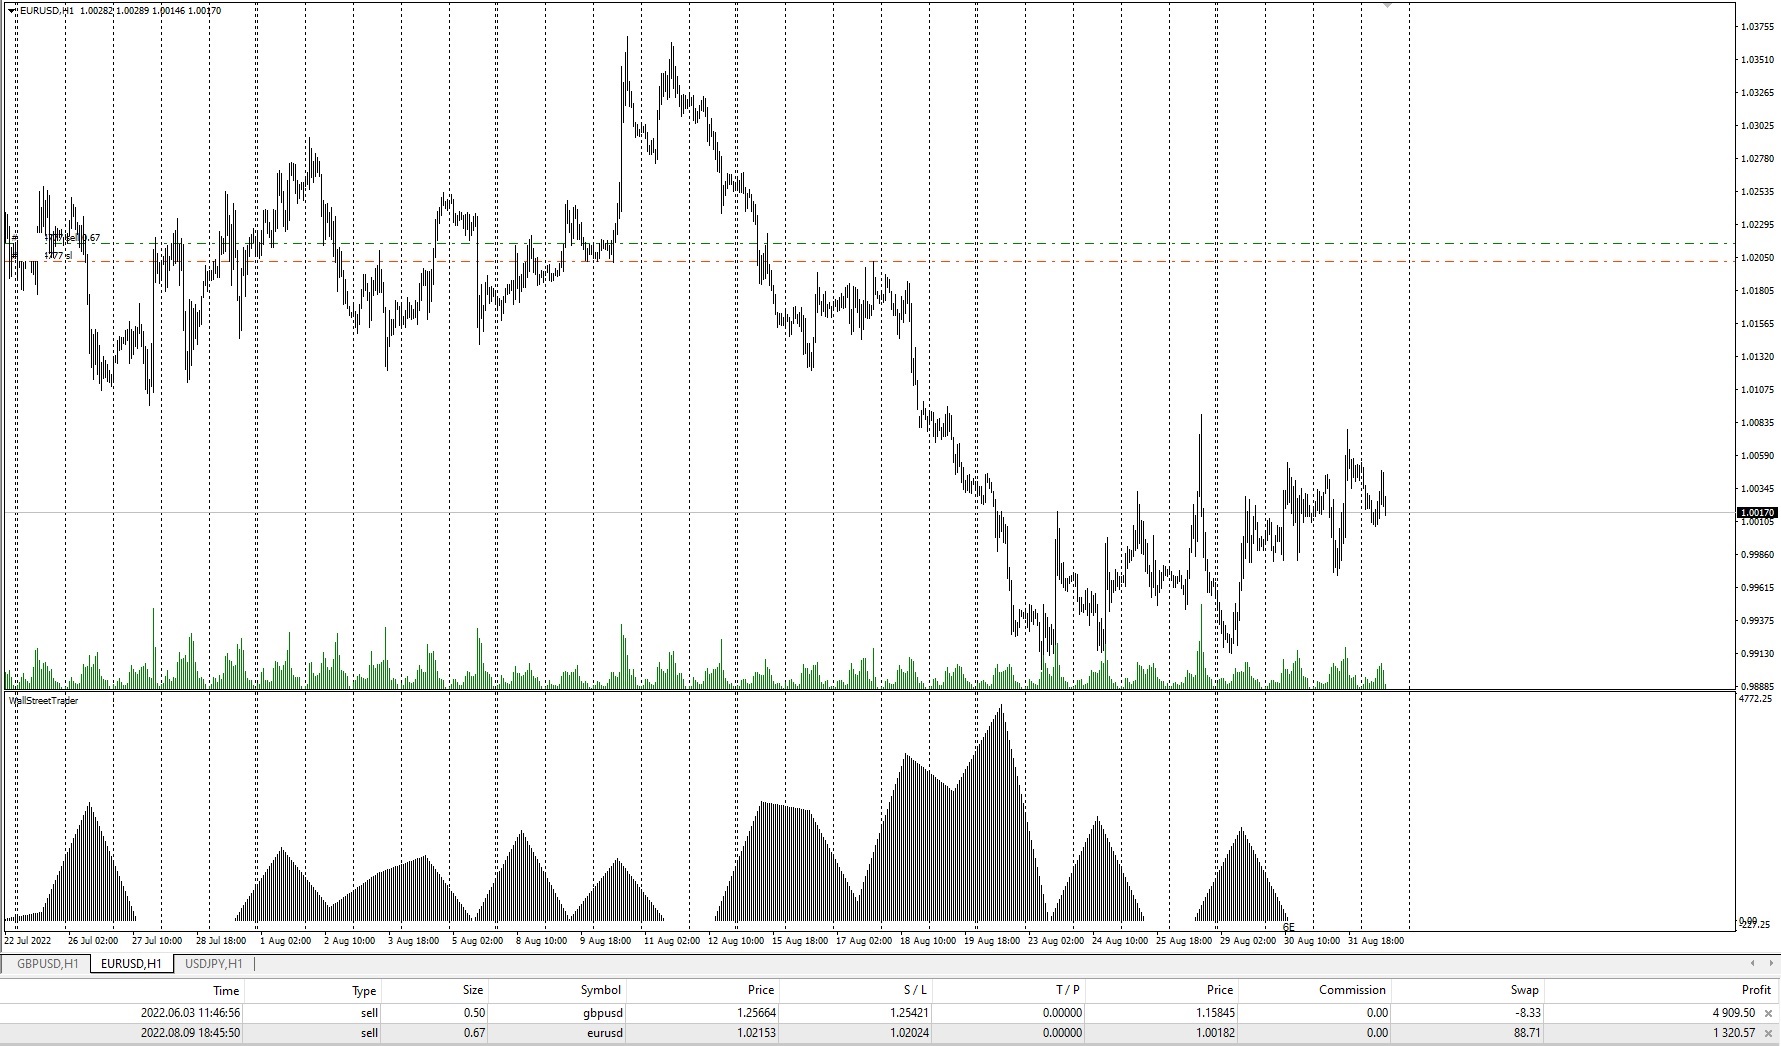
Example. Euro and British pound. October 5, 2022.
The example below shows two charts, EURUSD (green) and GBPUSD (yellow). At the bottom we see the volumes from the WST Pro indicator, at the beginning the volumes of the euro, and below – the pound.
As a result, it turns out that at the beginning, when the market was falling, a major player entered the British pound, and the next day, the euro:
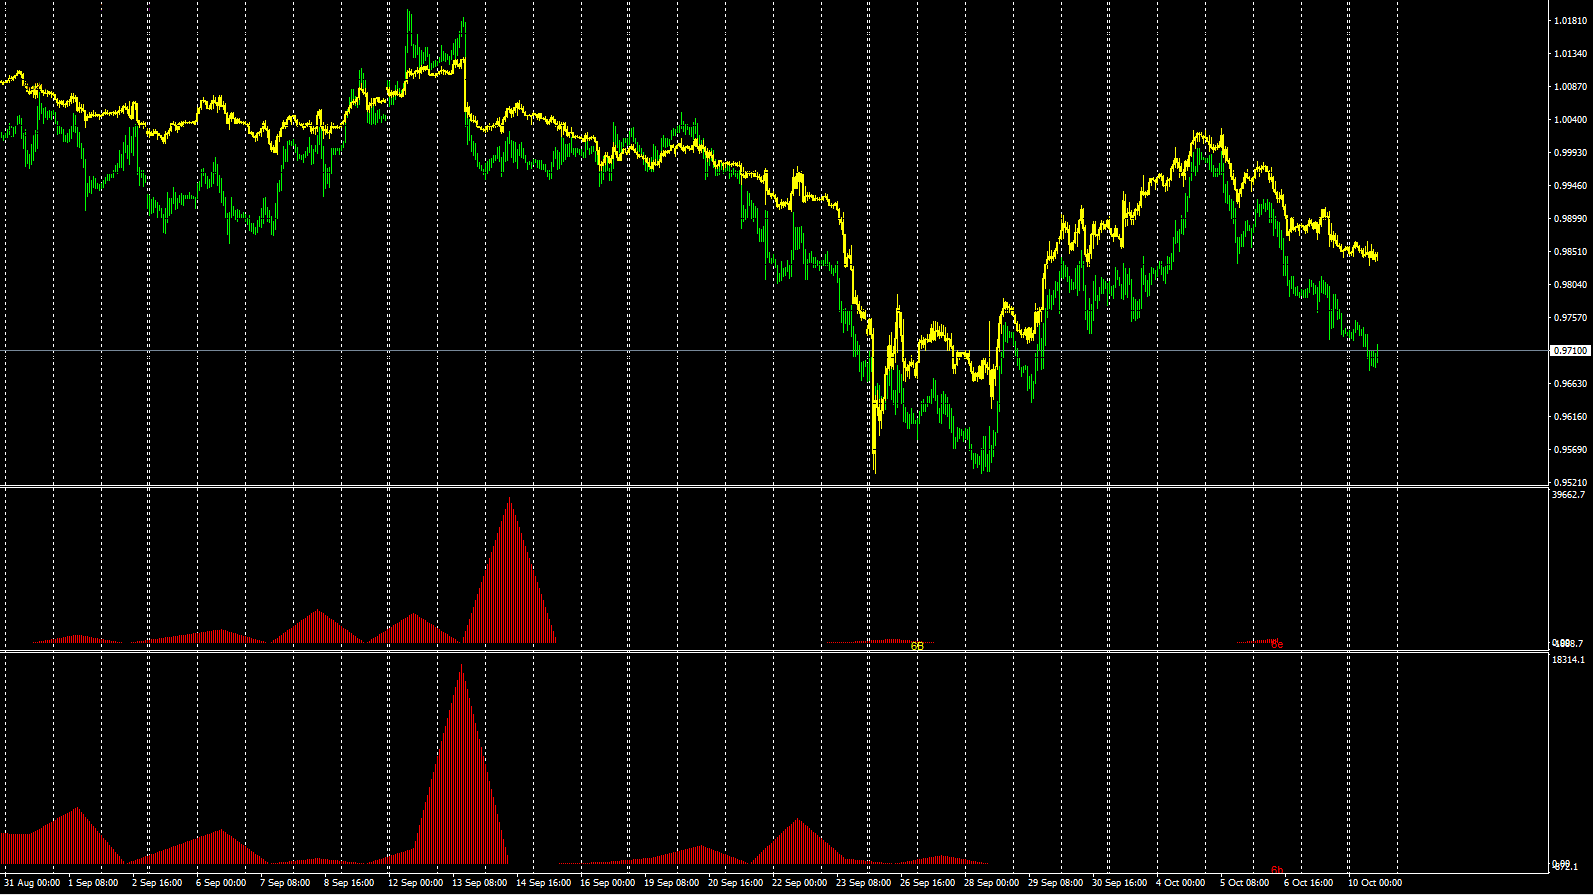
Accordingly, we see that major players are equally interested in buying the dollar and selling other currencies.
To enter the market, respectively, you can use the entry levels of a major player into the market:
And similarly for the British pound:
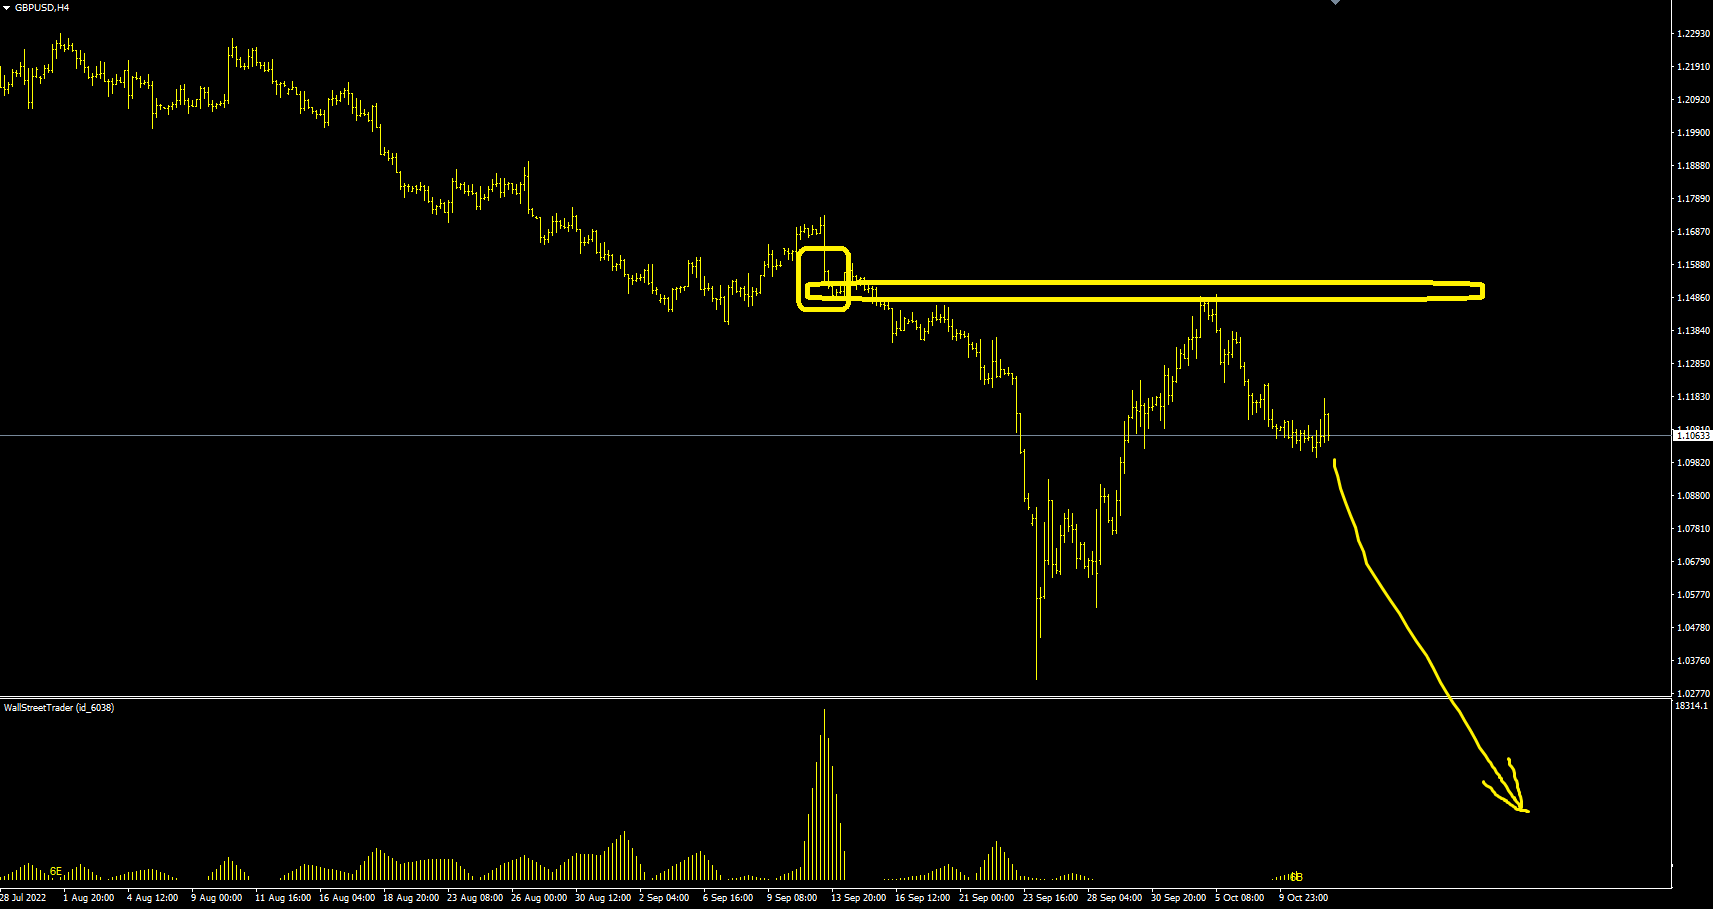
What will happen next – we will see in the next month.
Example. Oil. August 11, 2022.
A fairly simple situation on the Crude Oil futures (CL.CME). On July 4, large volume appeared in a falling market, marking a large entry into the market by a major player and the start of a downtrend.
On July 12 and 13, a major player entered the market again. After that, the price grew up to the level of 103.00, after which a major player entered the market again, sending prices lower. Here it became quite obvious that the market is pointing down, and you can enter a deal to sell. And as we see after that, the market really fell down:
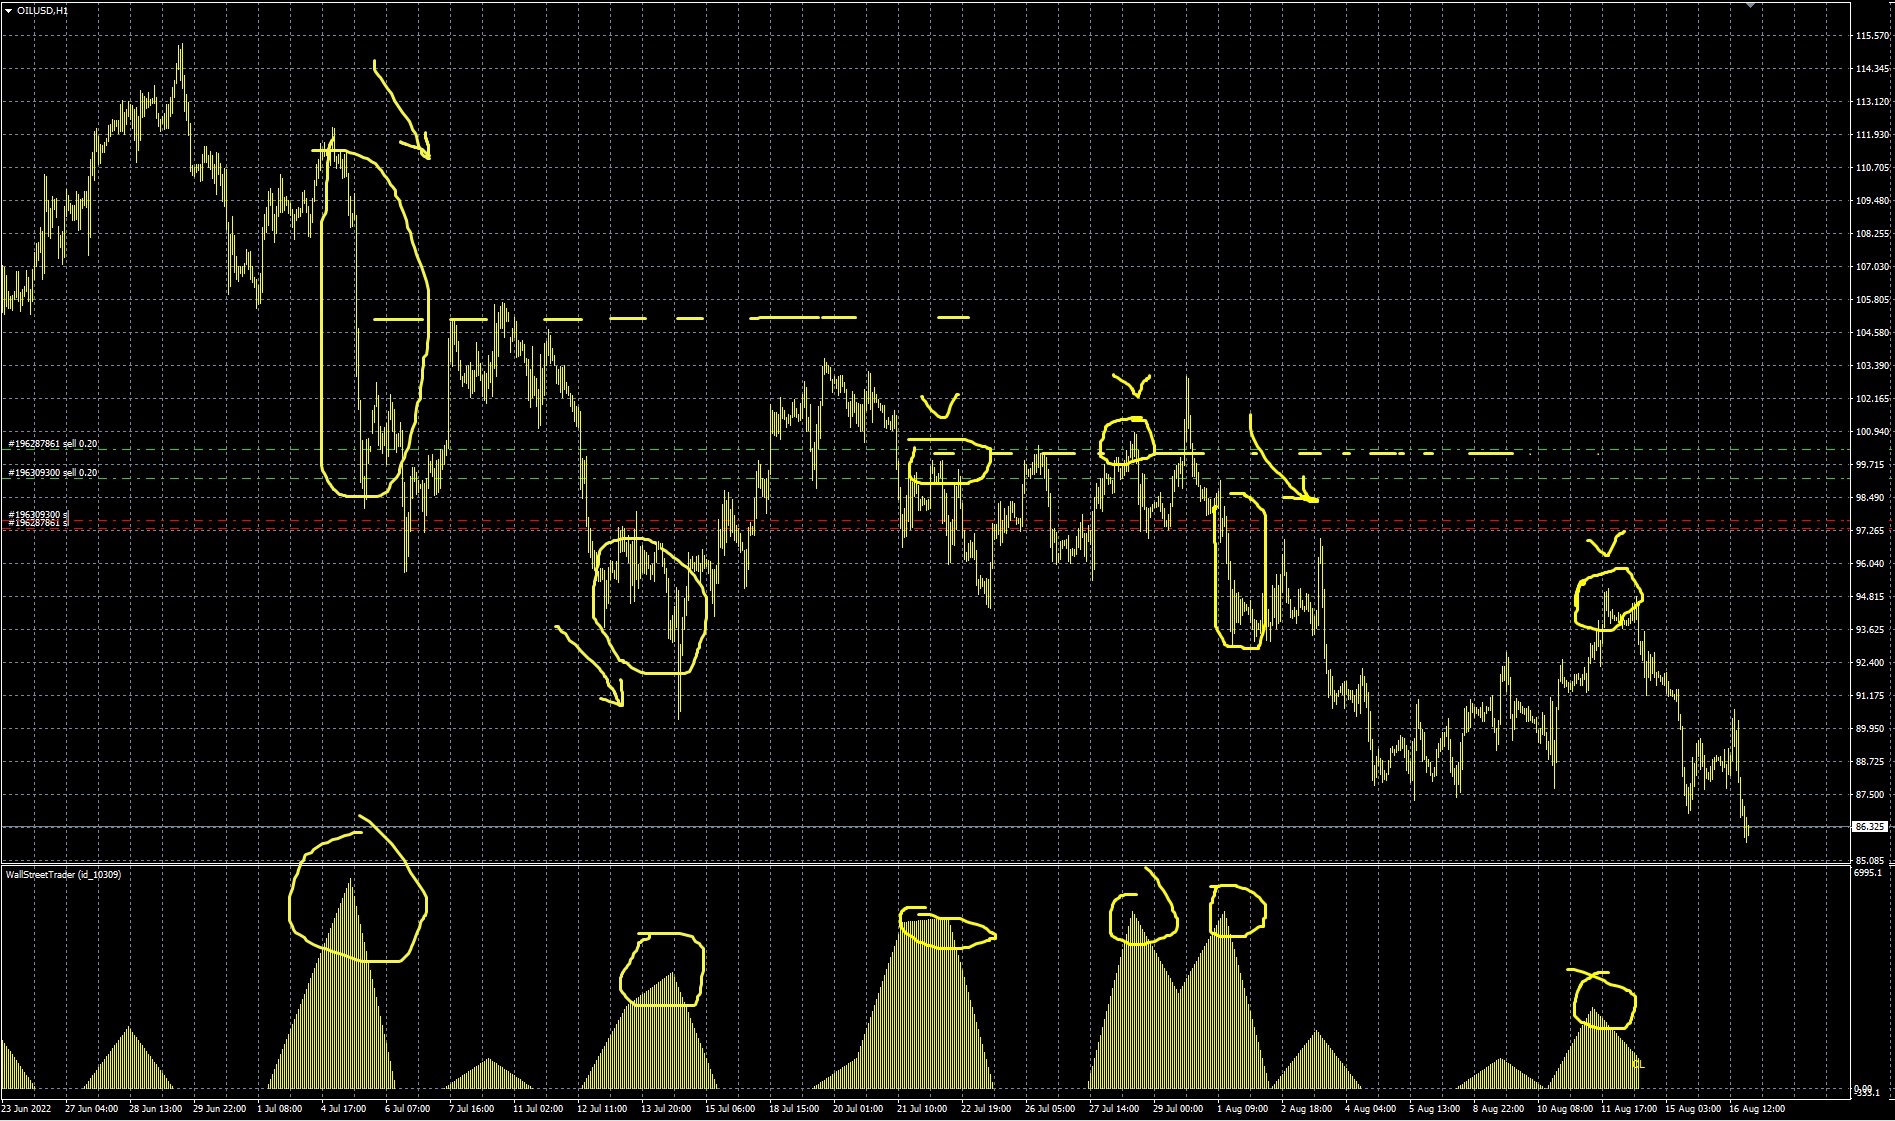
Then prices fell even lower, which can be seen in the history.
Cross Rate Trading
Although these contracts are illiquid on the Chicago Stock Exchange, and there are practically no trades on them, FOREX traders can still trade on them using the WST Pro indicator.
To do this, you need to find situations where it is clearly clear that, for example, the pound should rise and the yen should fall. As it was on December 15, 2020:
Options Analysis
If we talk about the WallStreetTrader indicator, then it also contains data on options. And this data can help us predict both the direction of price movement and determine the price levels at which large players hedge their positions.
Example. E-mini S&P 500 futures dated October 13, 2022.
In the picture we see the last two liquid futures contracts, from June 15 and September 15, 2022. Major players entered the sale in June, and in September they entered the market again, but in a growing market (this was due to the fact that the previous contract had ended, and major players postponed their transactions to a new, December one, regardless of what prices were on the market, but at the same time the price did not rise above the level of sales from the June transactions of a major player).
Seeing such a picture, we can conclude that a trend is being prepared. And if you look at the number of options traded, you can see that they were mostly puts. All this adds up to a single picture of what can be expected to decrease in the prices of the E-mini S&P 500 index in the future:

Do Not Trade When It Is Not Clear
I want to add one important note that will save you from losses.
Although we try to analyze large volumes in the market, there are situations when it is difficult to understand what is happening in the market.
On the one hand, we have light patterns, or situations where the chart shows very clearly how a major player is positioned. And you can safely get up in the deal. But sometimes it is difficult to determine. I will say from experience that many traders begin to guess in such cases and make multidirectional transactions. And this is a big mistake. If you want to have a well-growing trading account balance, you only need to enter trades where you can clearly see where the big players’ trades are heading. And wait out those times when there is no such understanding.
The trading strategy is medium and long term. And short-term players have a common “overtrading” problem. When instead of making a small number of good trades, they try to trade as often as possible, even where there is no clear understanding of what is happening in the market. And this is a big mistake. Because this kind of thinking leads to losing trades.
Money Management Or Risk Management
What is the best way to open trades and exit them? Speaking from experience, the best way to enter the market is to open several transactions at once (in one direction, of course). After all, a major player does the same, entering the market every day.
This allows you to fix part of the profit after the price has gone in your direction. In this case, in the event of a subsequent stop loss, you will not have a loss on this transaction in the amount.
It is best to enter into transactions at levels where large players themselves begin to enter. After all, they tend to defend their positions. And at such levels, you can enter with a little stop loss order. And then, when the price moves in your direction, you can re-open deals in the direction of the trend. In this case, you can place breakeven orders and build a pyramid of orders without fear of taking a loss on the trade. This approach is important during long trends as allows capitalization of profits.
The second way to enter a trade is to calculate the average trade of a major player from the market profile, and enter part of the orders there:
Pattern trading cases
Example. Bitcoin. October 10, 2022.
Here, in general, everything is quite clear. A major player presses the price and enters the market. When the price rolled back up, it was possible to enter the sale. It can be seen further that the volumes also appear in the direction of the market fall.
Example. Futures on the ruble. January 2022.
With the same success, you can analyze other futures on the CME Group market. For example, we all remember the strong drawdown of the ruble in February 2022. But a major player entered the sale of the ruble long before that:
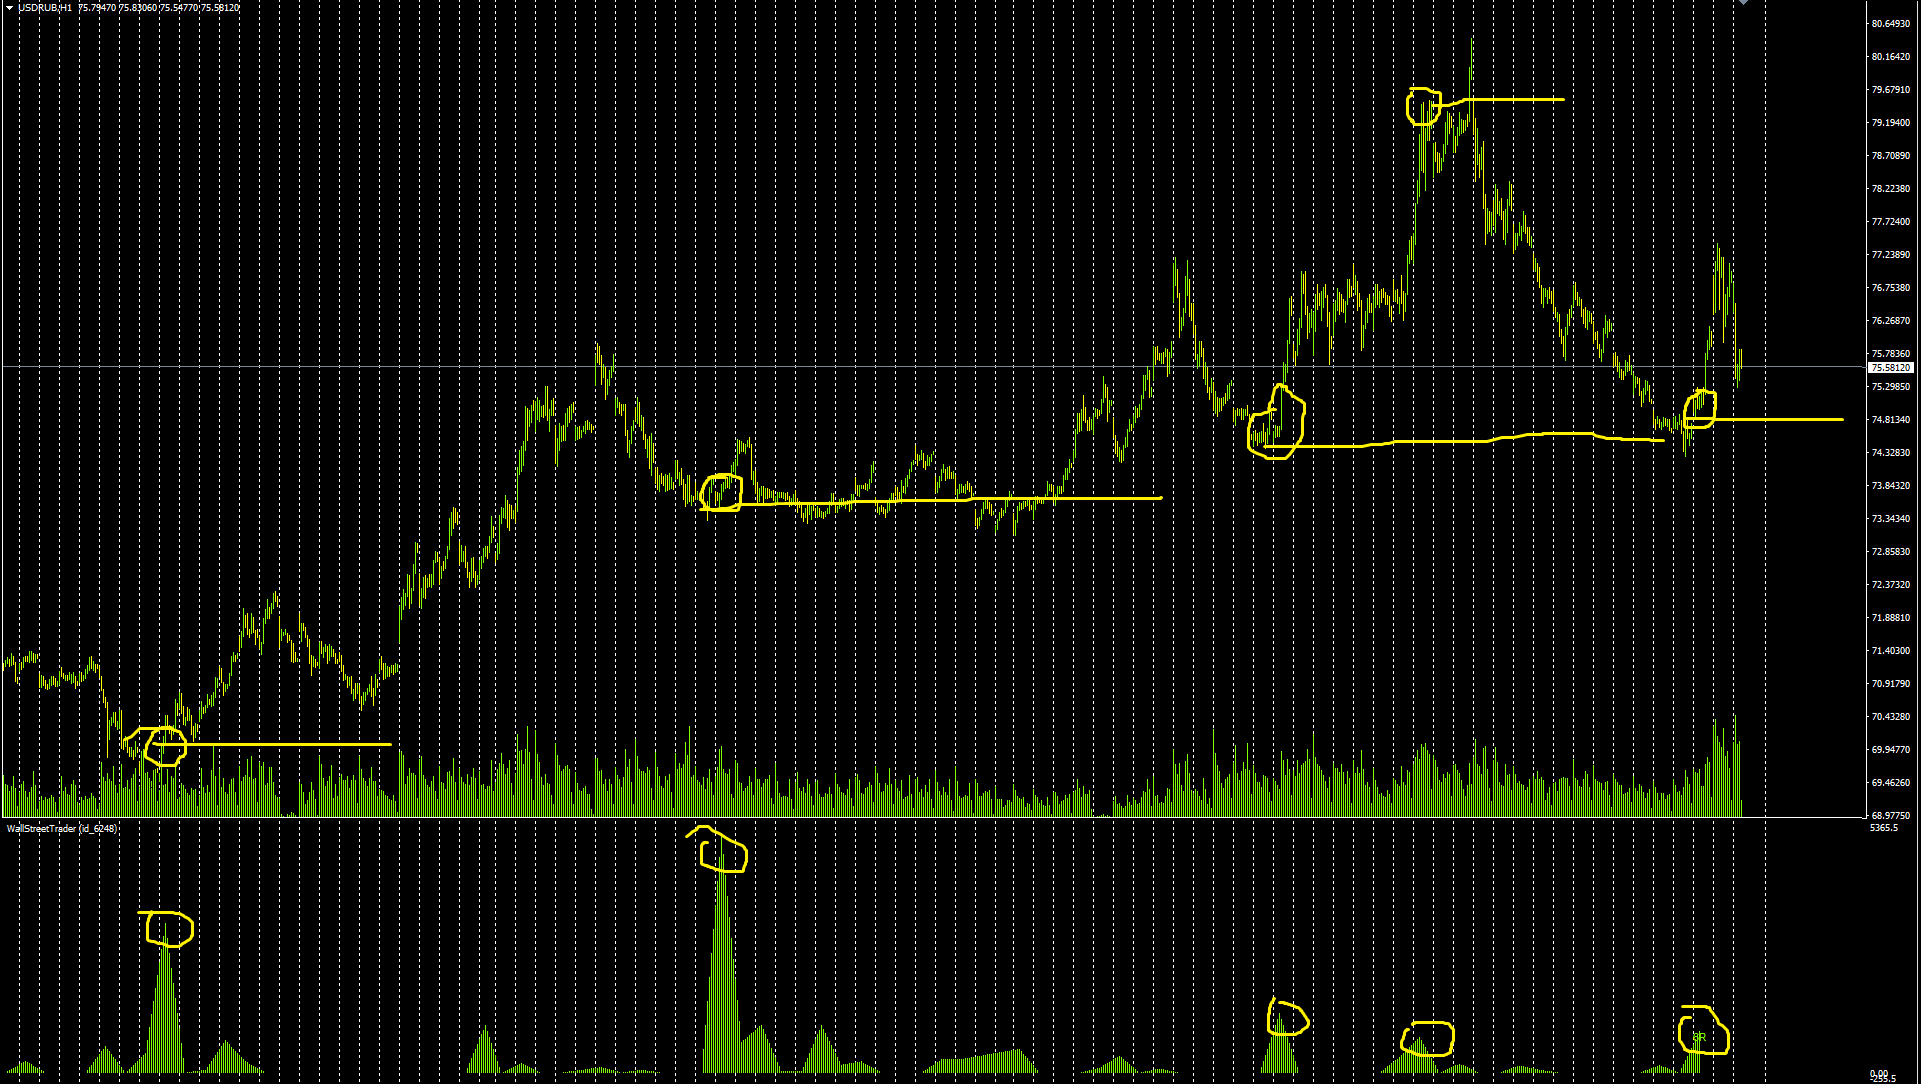
After that, the ruble just crashed.
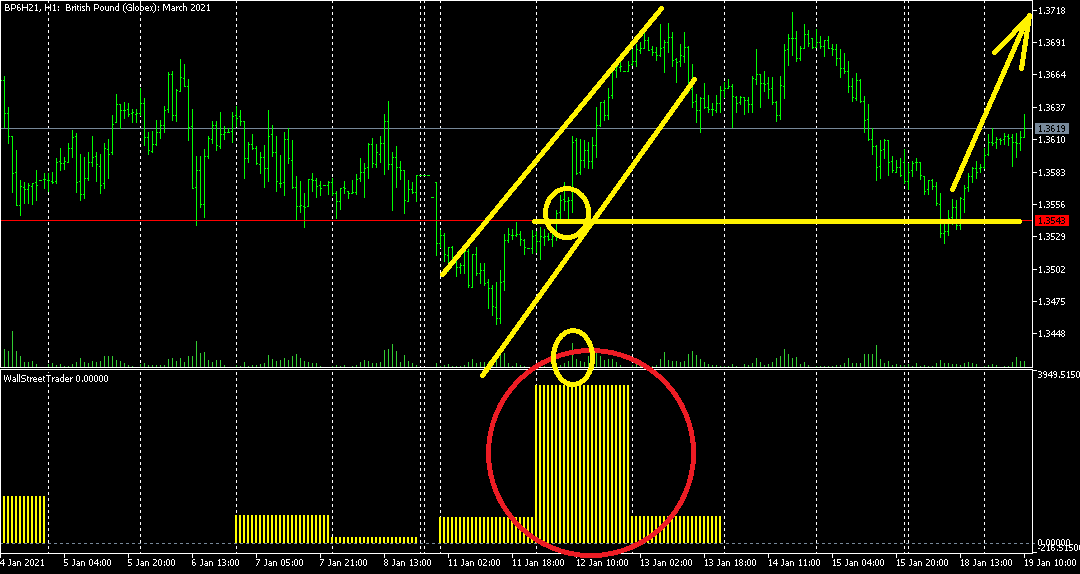
Example. Futures for gold. February 10, 2021.
Here we see a fairly simple situation, namely a downtrend (left side of the chart). And then a small rollback up (the middle of the chart), during which a major player kept the price at the same level, entering the market for sale, and pushing the price down. After that the market fell.
Then, on February 10, when there was another return of prices upwards, a major player entered the market again, and it became clear that he would not go higher, and it was possible to sell:
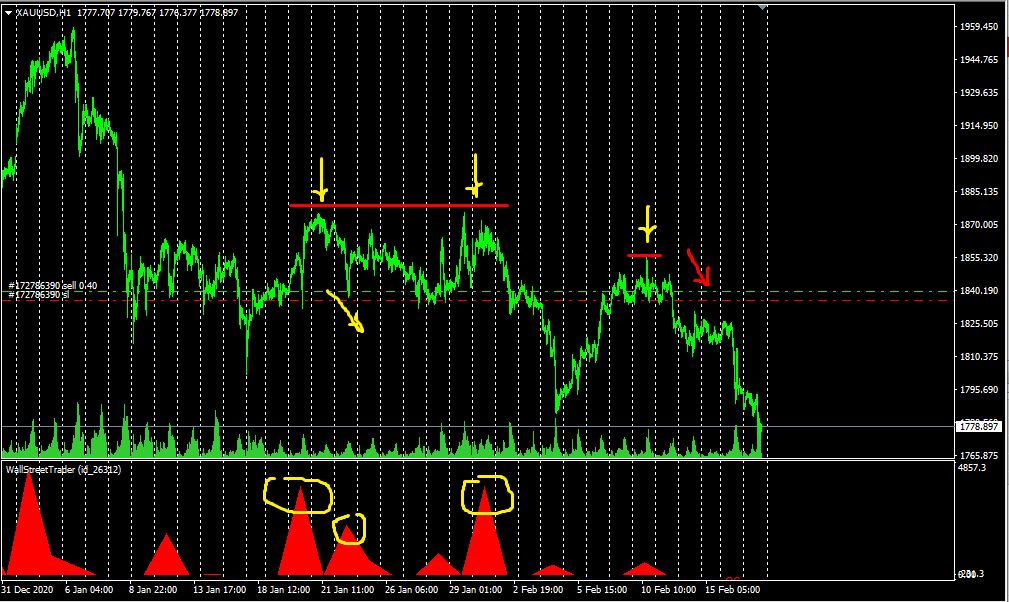
Which subsequently led to an even greater fall in the market:
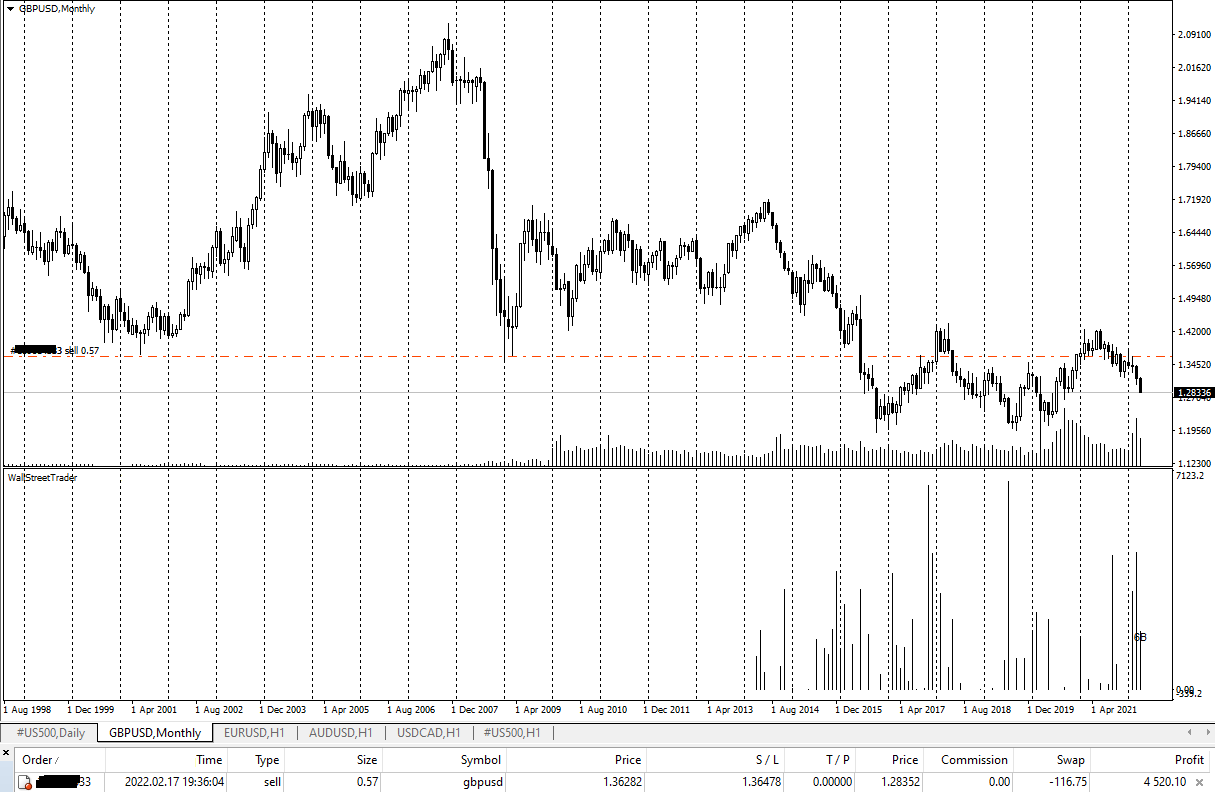
Another example. GBPUSD. February 22, 2022.
Another example, when large players keep the level, not letting the price go higher, and reinforcing sales with volumes:
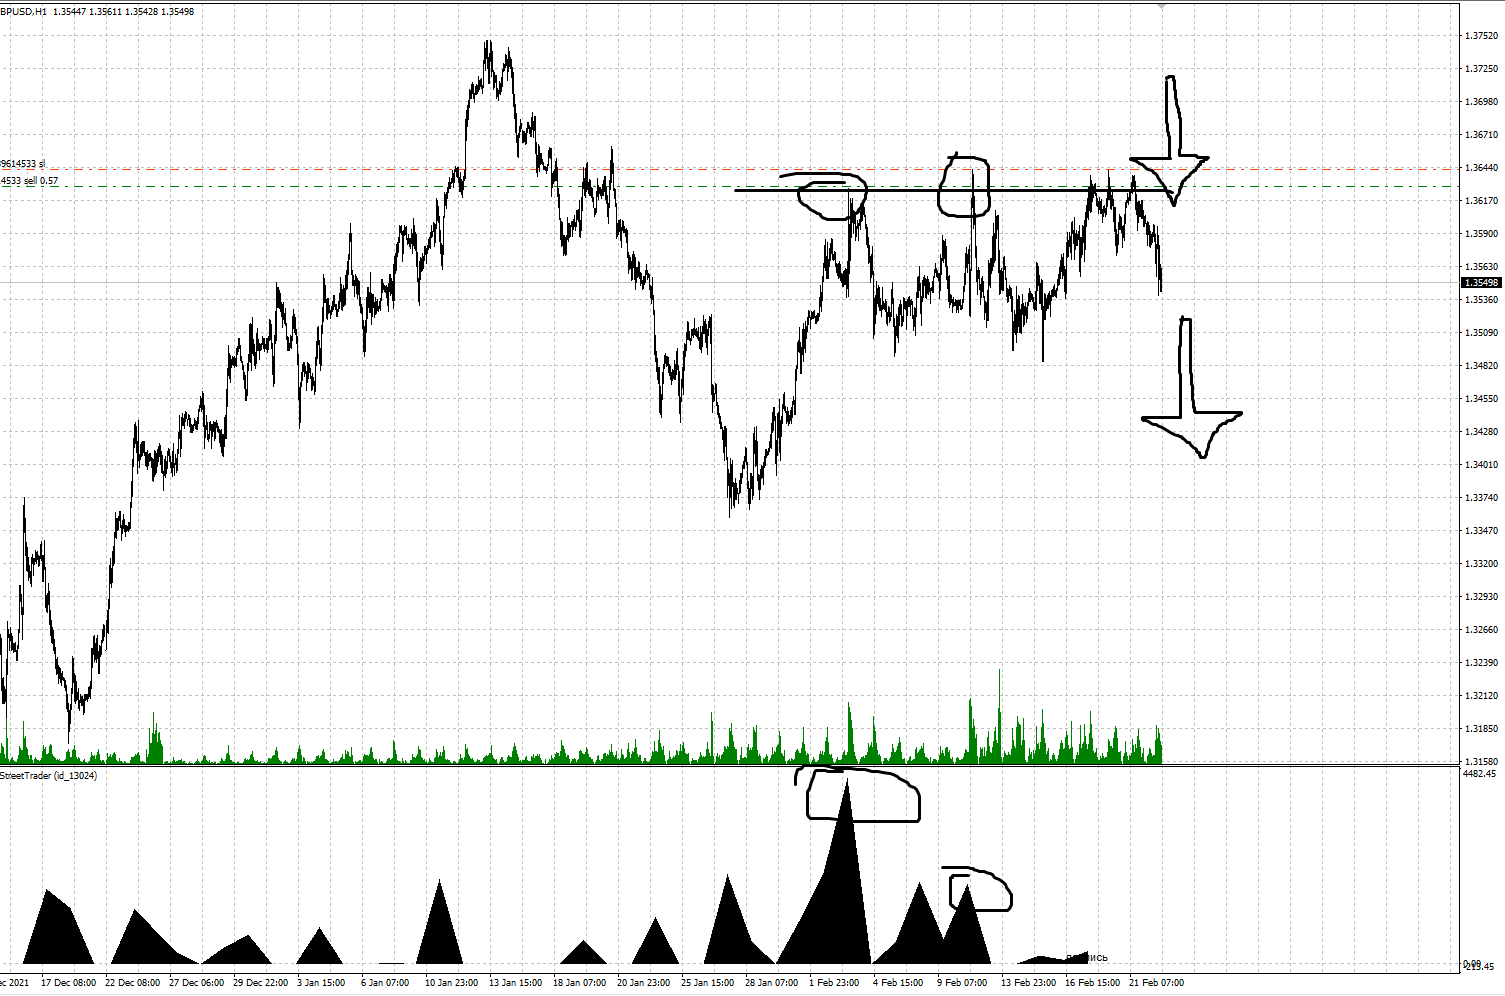
On February 20, it was possible to enter the beginning trend. In the future, the price went down, giving thousands of points of profit.
Moreover, in the future, large players entered the market again and again, opening new sell orders, which made it possible to enter the market with additional orders:
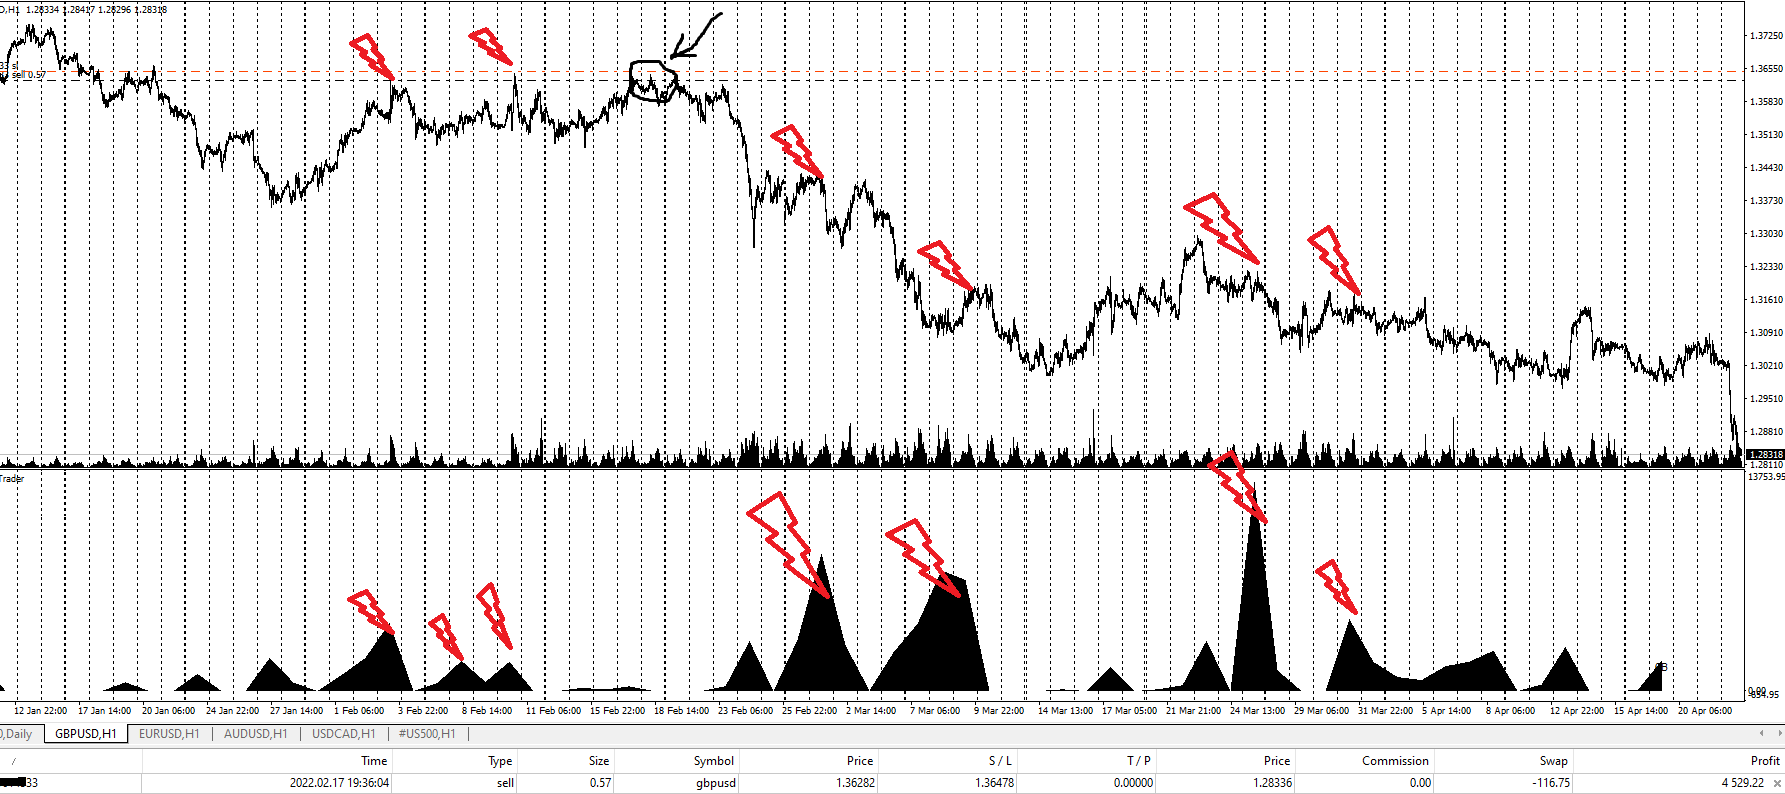
Looking further, the British pound fell over 1,500 points:
In another timeframe:
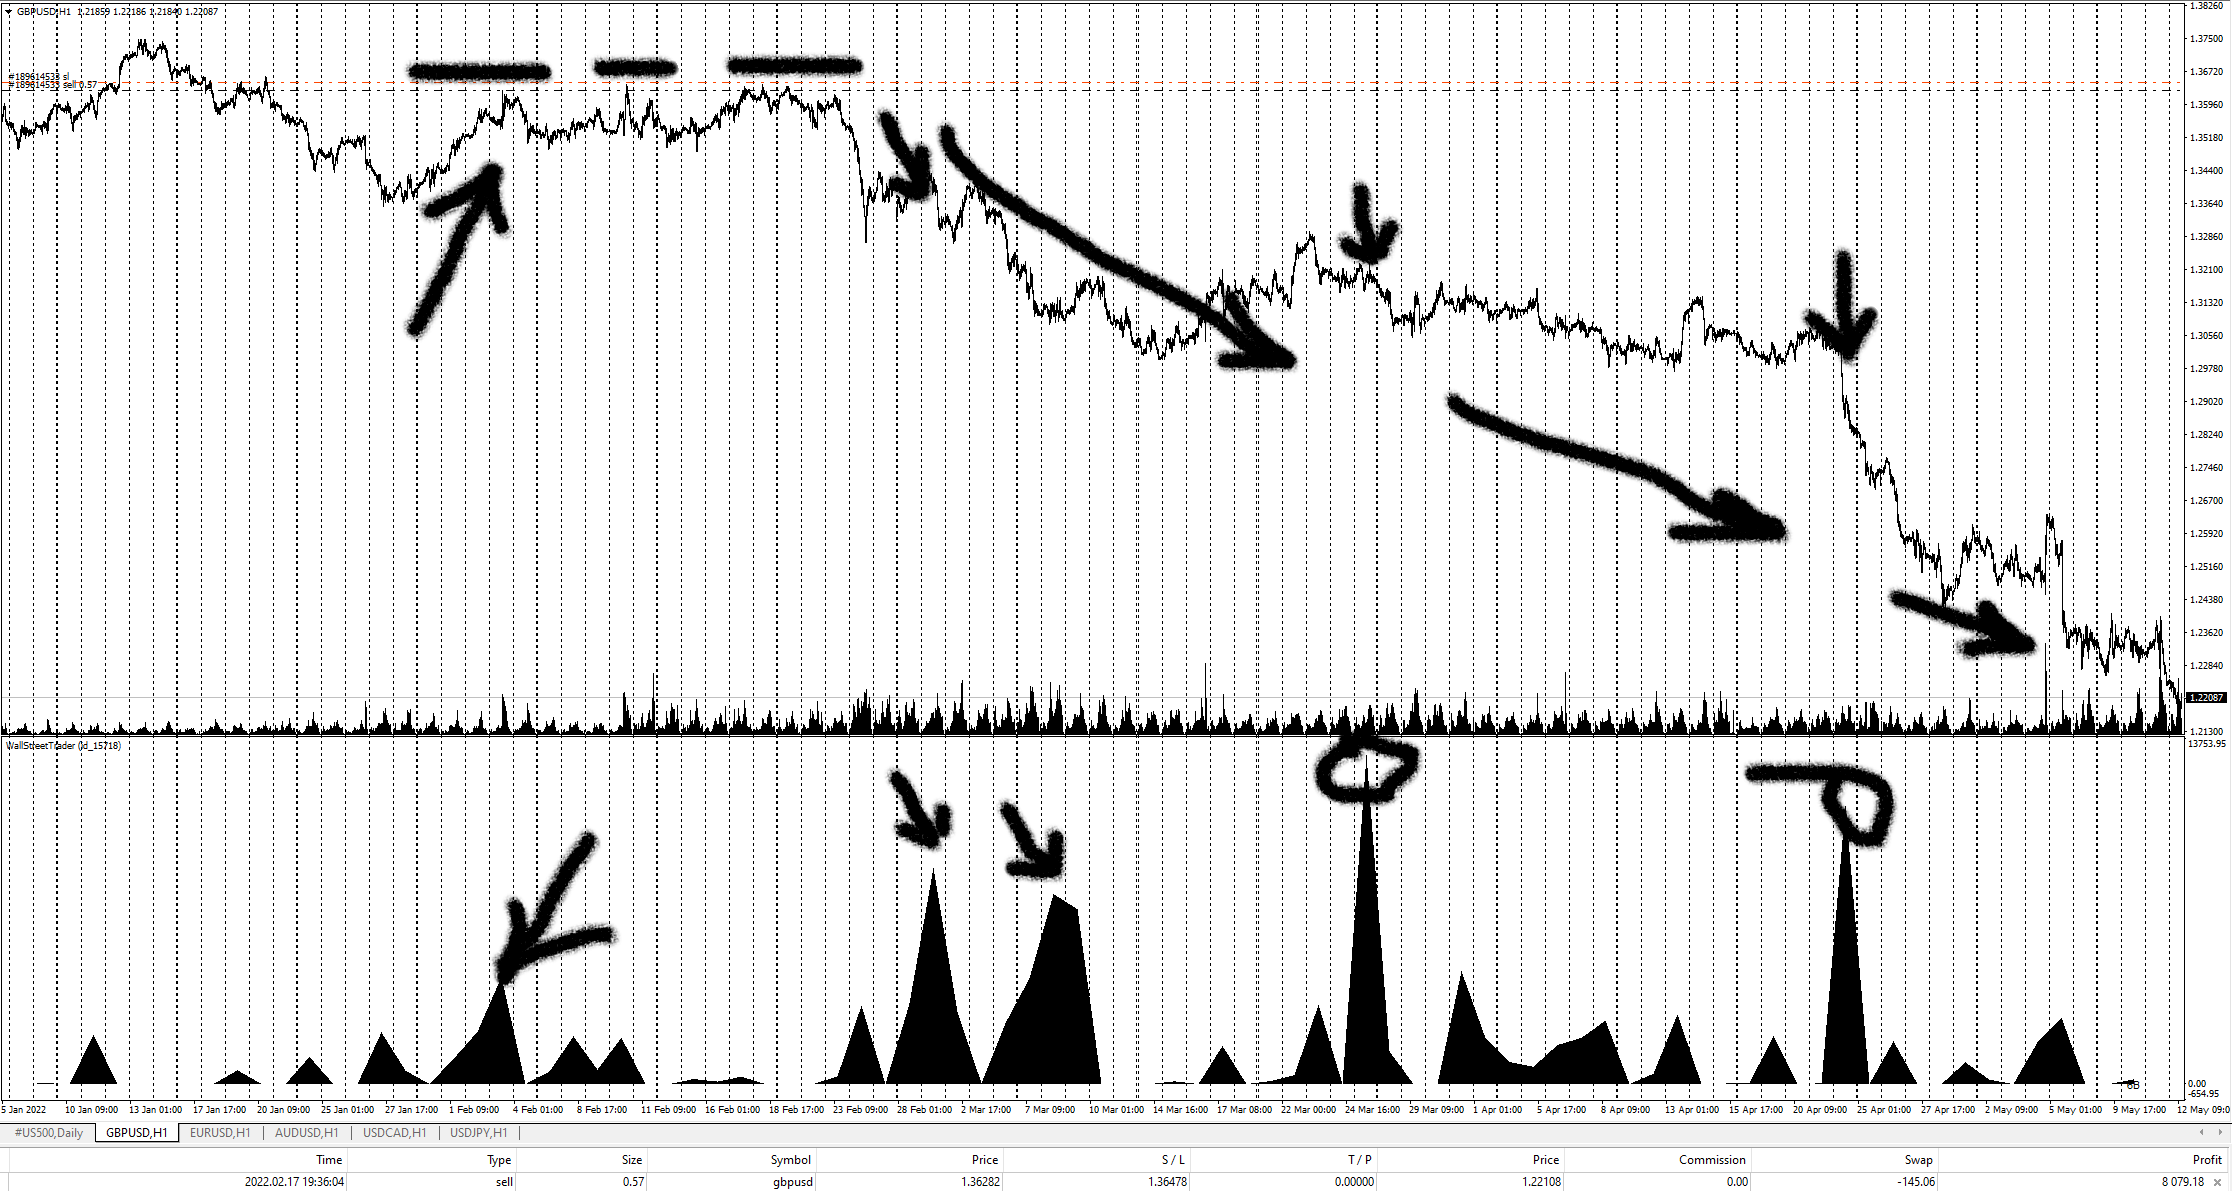
As you can see, all volumes were only for the continuation of the trend, so it was not worth closing sales. You could even resell.
Moreover, there were many such situations when it was obvious that the emerging large volume was aimed at selling (for example, on September 15, 2022 – the right side of the chart – you can open a new short position on the British pound):
Which results in an additional thousand more points of profit:
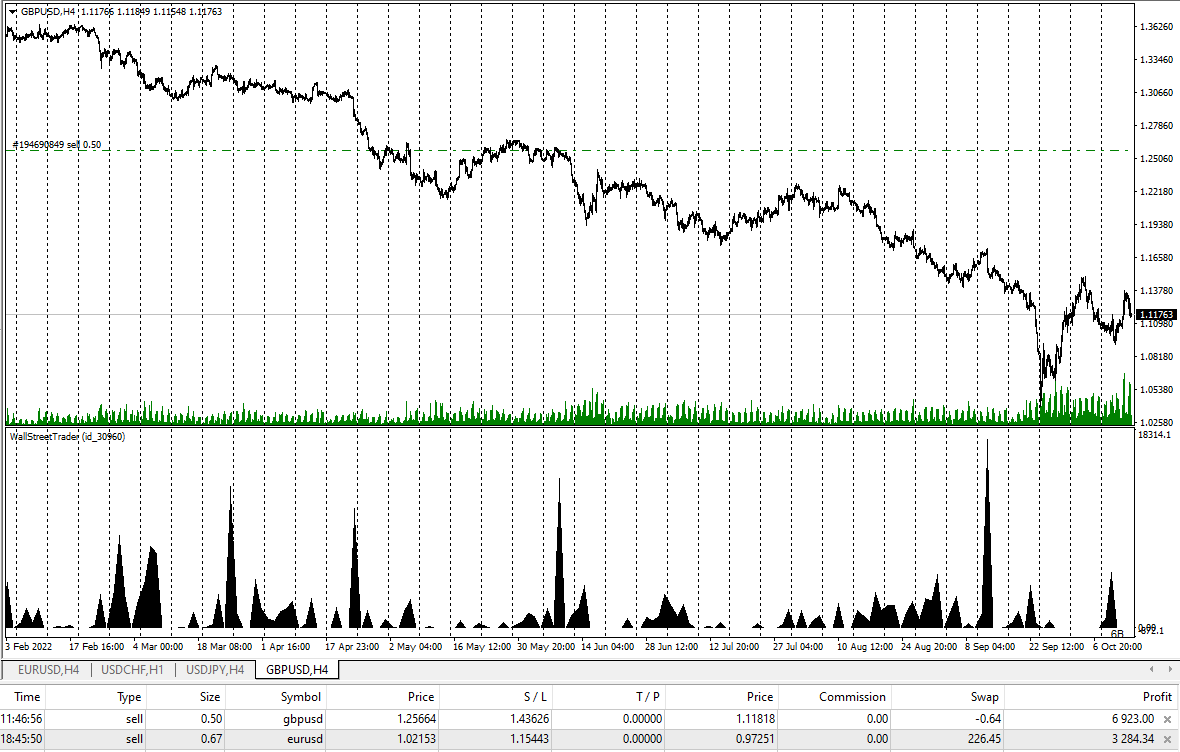
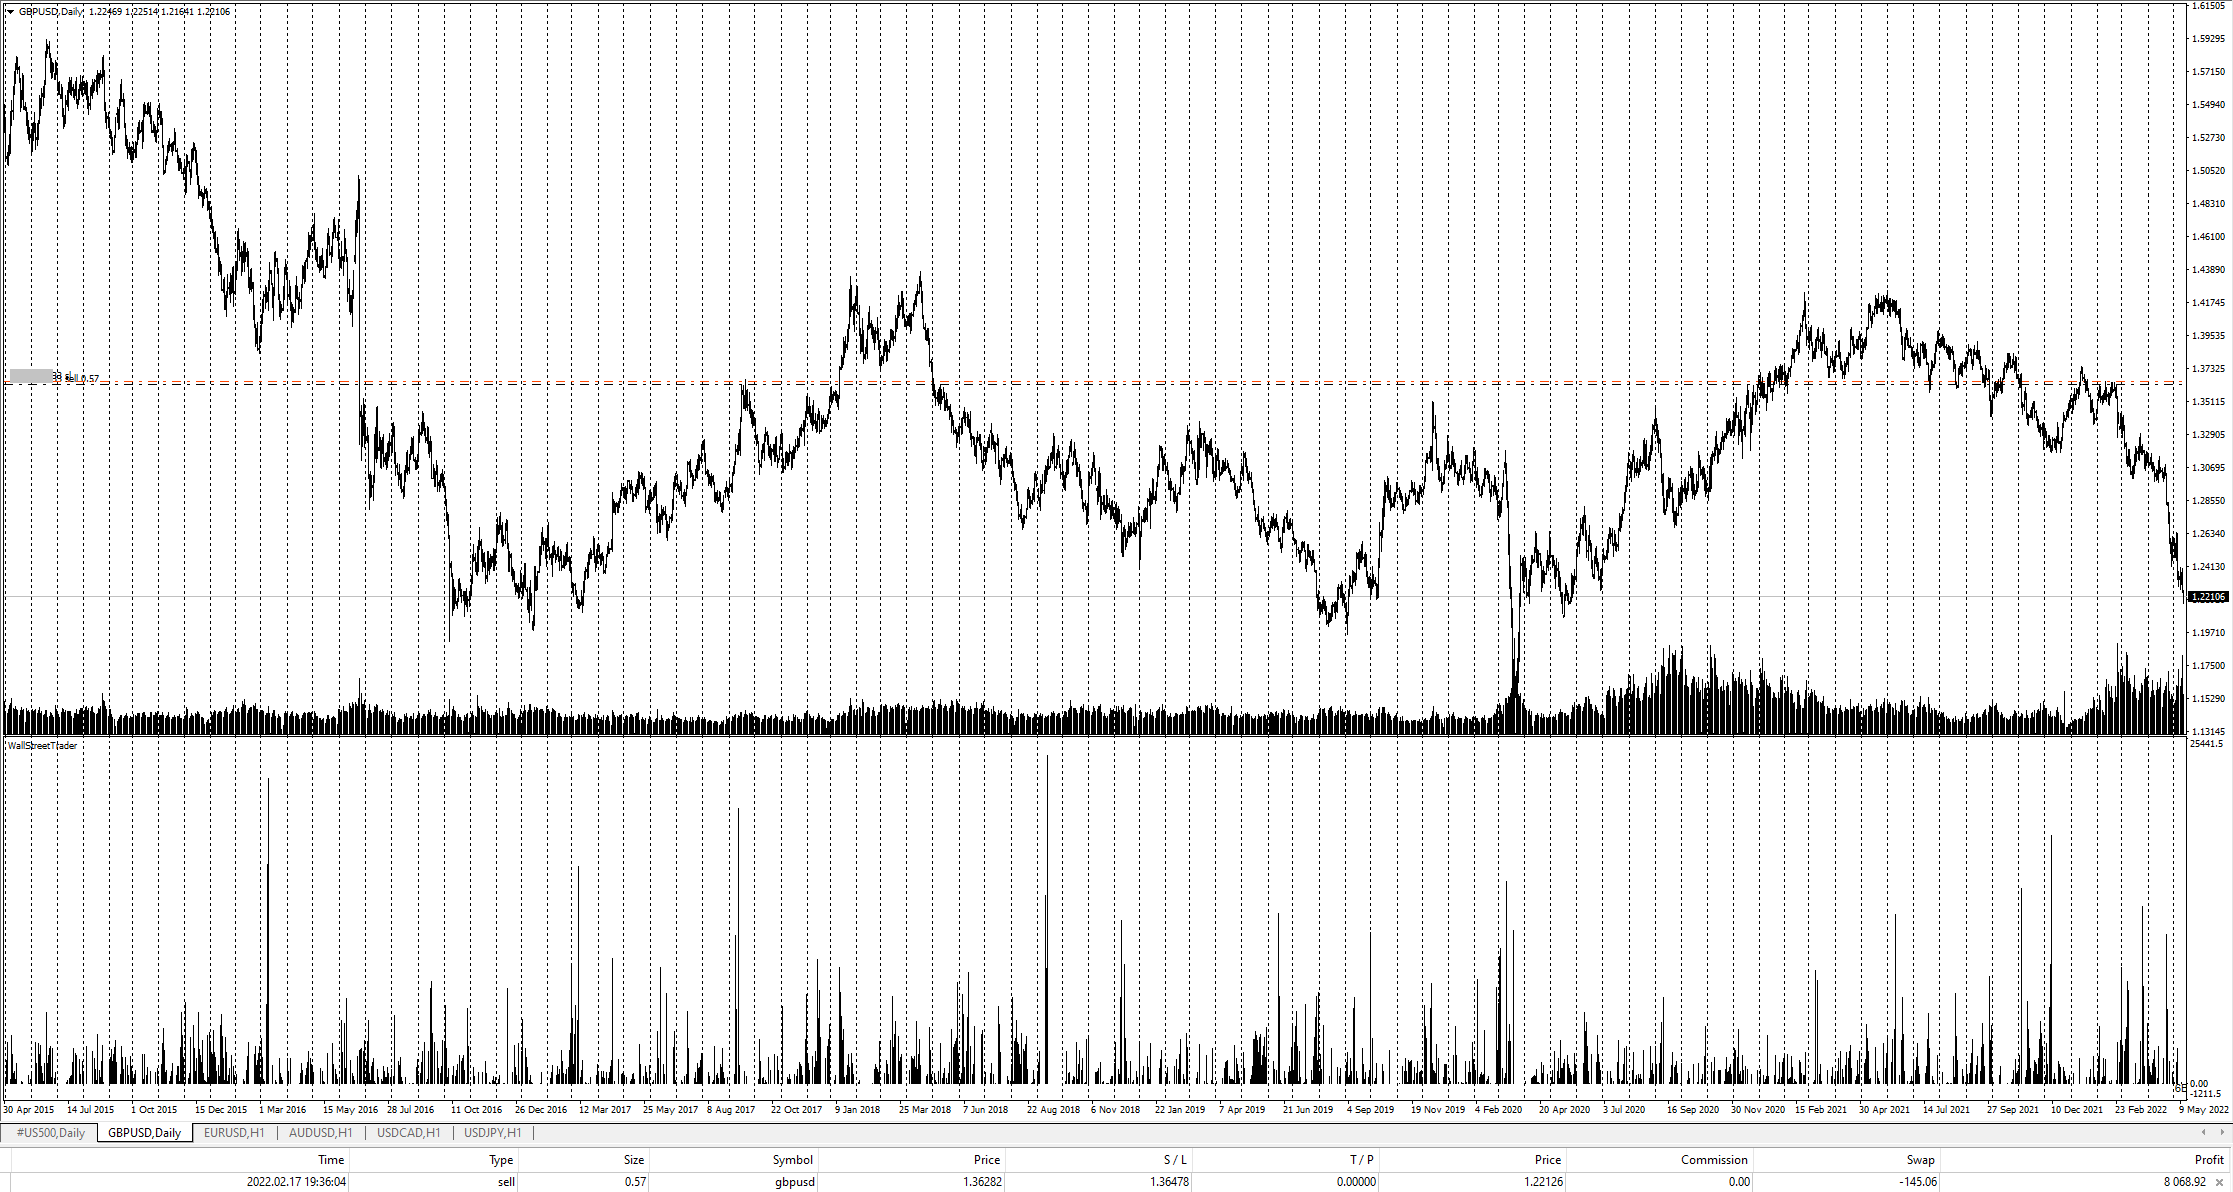
And plus the profit from the previous trade:

Thus, trading in the pound brought more than 3,000 points of profit with a rather conservative approach, without additional opening of new transactions in line with the trend in order to capitalize the transaction.
Example. Eurodollar. March 2022.
A similar situation was on other currency pairs. An example of a euro futures – at the end of February, a large volume appeared on the fall of the market (left side of the chart). A major player has set a downward trend.
Then there were two more moments when the market was pushed through on volume. While the market was always growing lightly, which made it possible to open deals on the fall of the market:
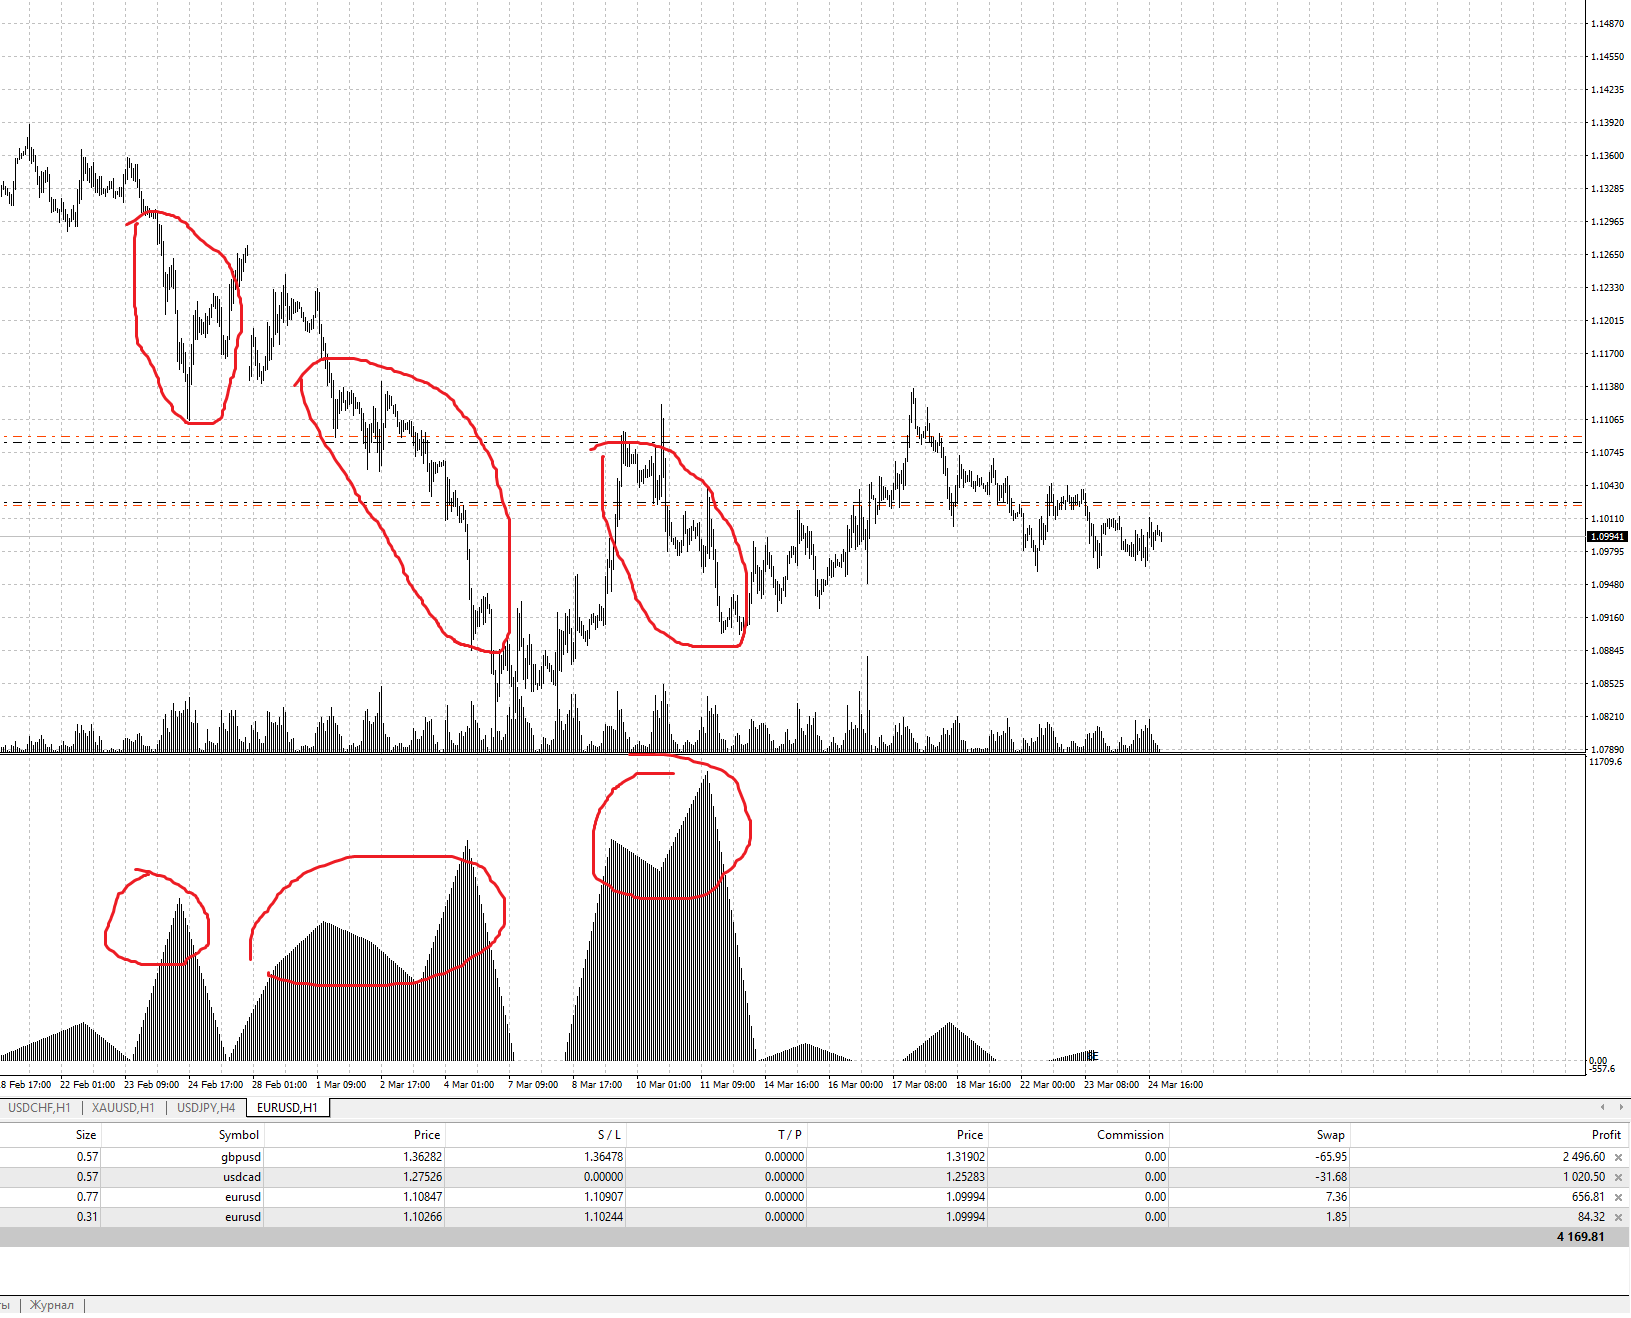
The market subsequently fell.
But having fallen, further large volumes appeared to continue the downtrend (the right side of the chart), which indicated that the price would go even lower:
In such cases, you can open an order for short. And it paid off:
Example. Japanese yen. May 2022.
Another example of how you can trade with the trend. Beginning of May 2022. All volumes of a major player appear on the growth of the market. Which suggests that in the event of a rollback down, it will be possible to enter a buy position:
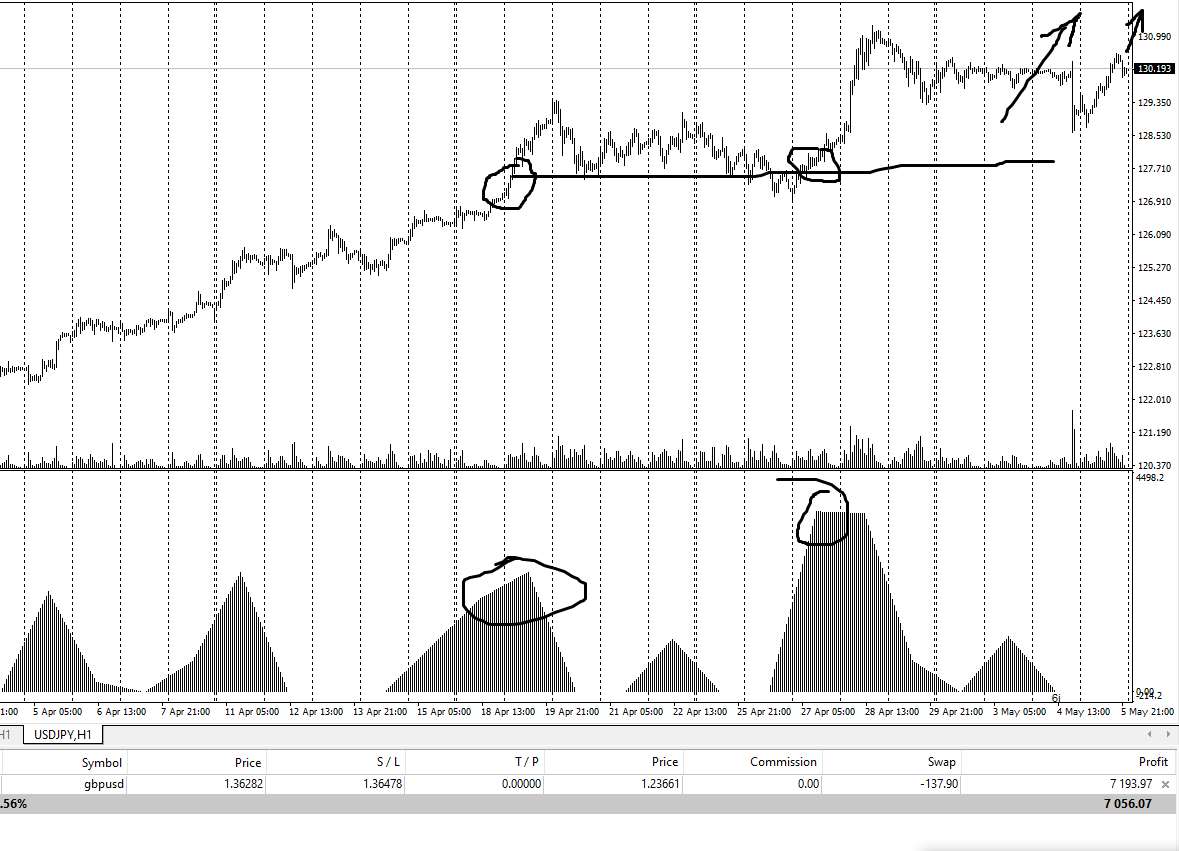
In such cases, you can place buy limit orders with a close little stop loss order. And as you can see further, the price really rolled back a little, after which the major player again began to defend his positions in the purchase, then pushing the price up:
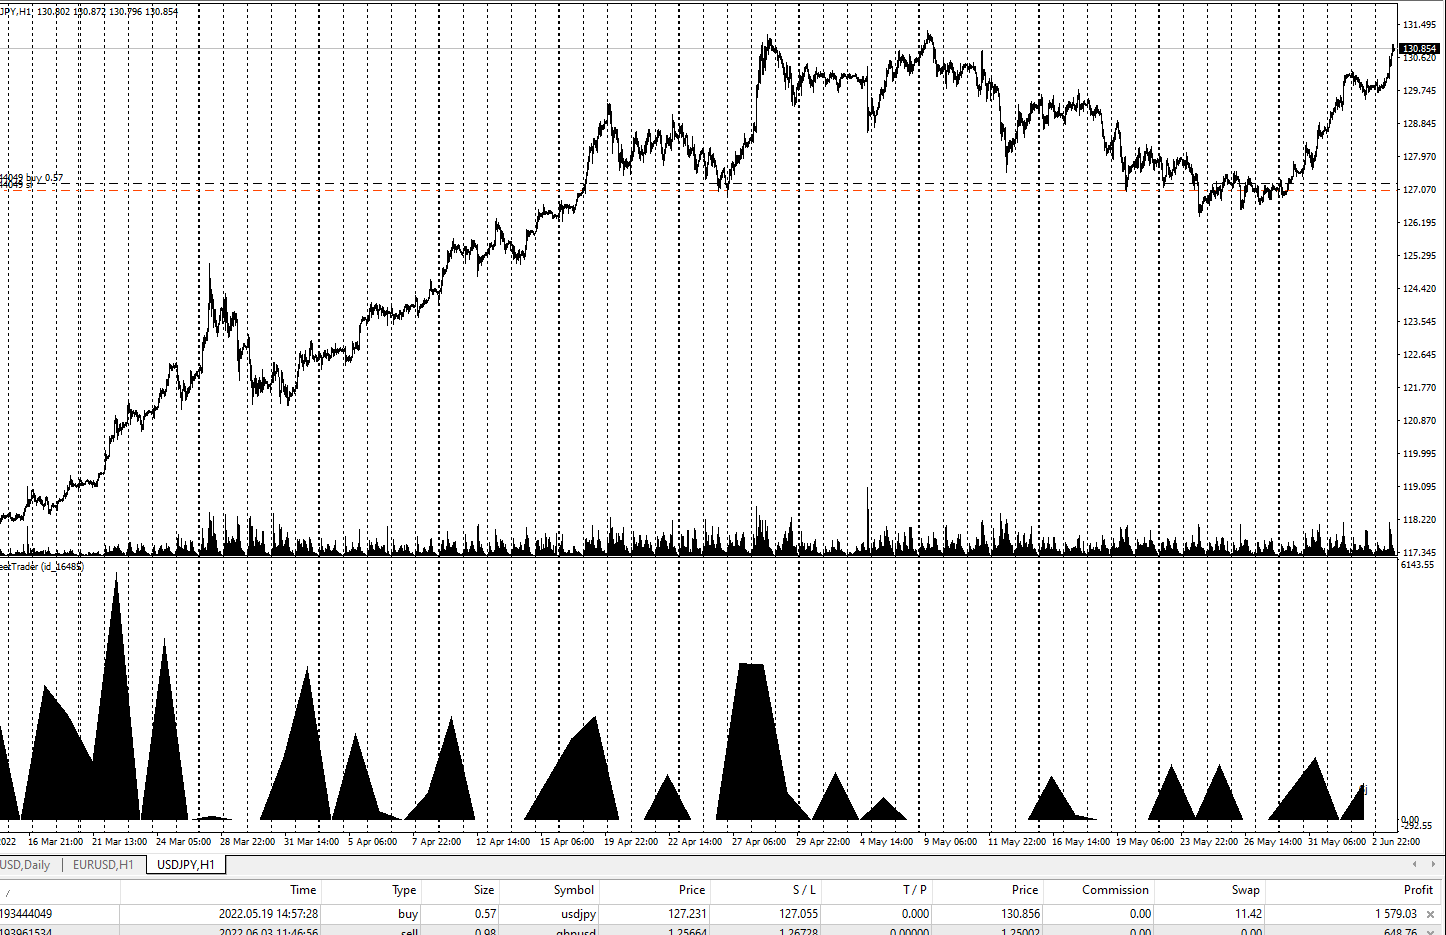
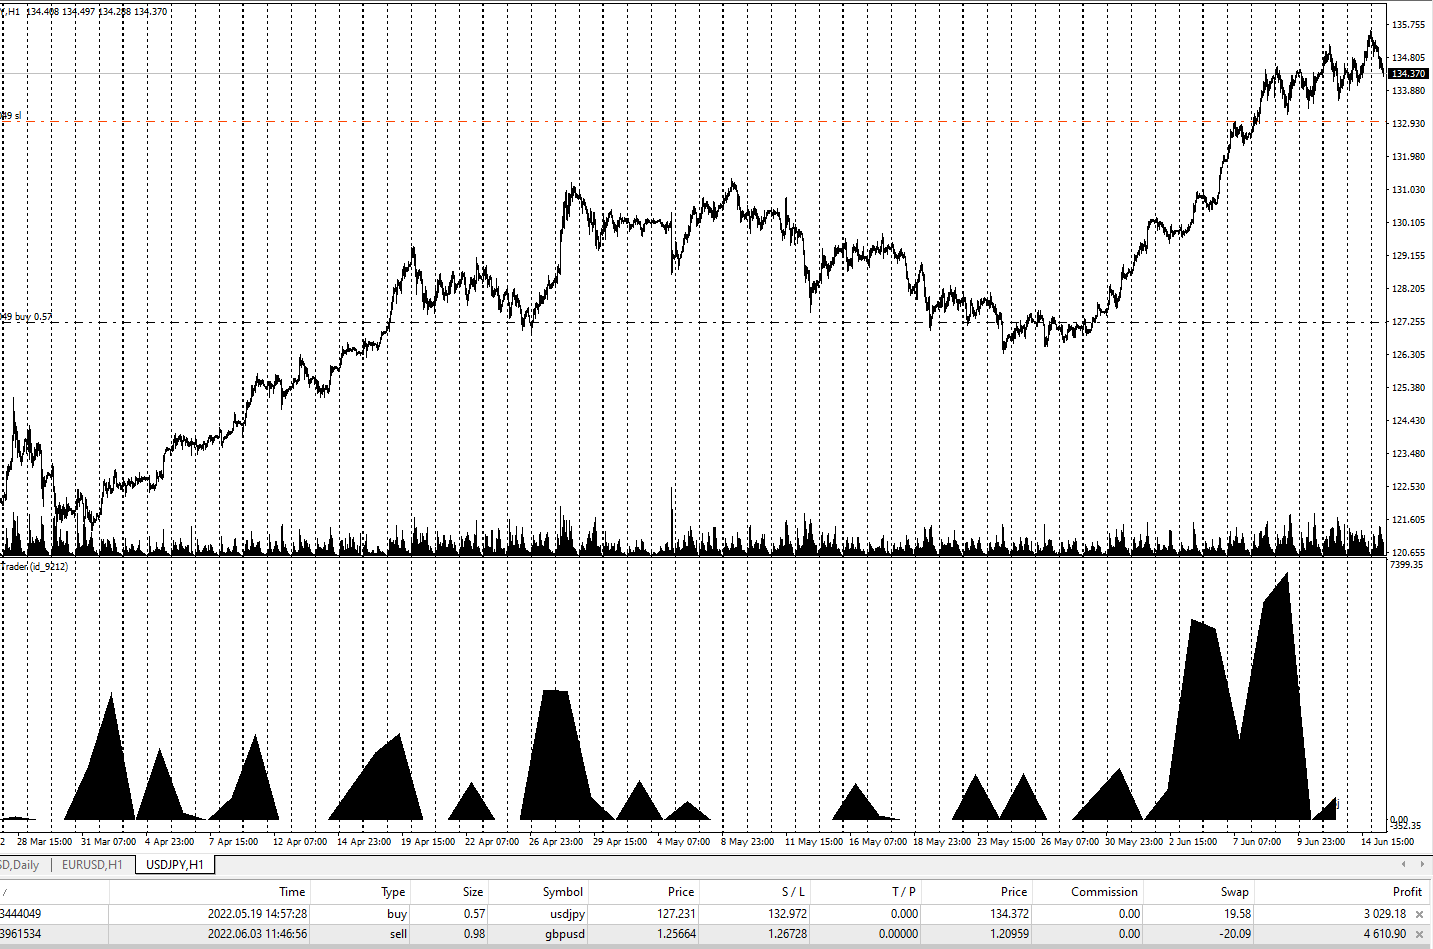
Moreover, further buy volumes appeared, which indicated that it was not worth closing the position, and the price would go higher:
Useful Resources
Forum thread where people talk about WallStreetTrader.
Wall Street Trader calculates the fundamentals of the market based on the volume of trades of large players. However, you can use the received data with any type of analysis / trading strategy that is convenient for you. Similar trading schemes can be found on other resources. We also suggest that you familiarize yourself with the LRA book available today that reveal the philosophy of trading based on following the “smart money of the market”.
Tom Leksey
Locked-in Range Analysis
Attention! This article is not a recommendation for transactions.