Barchart made handy charts with history: euro example, and now they are free online.
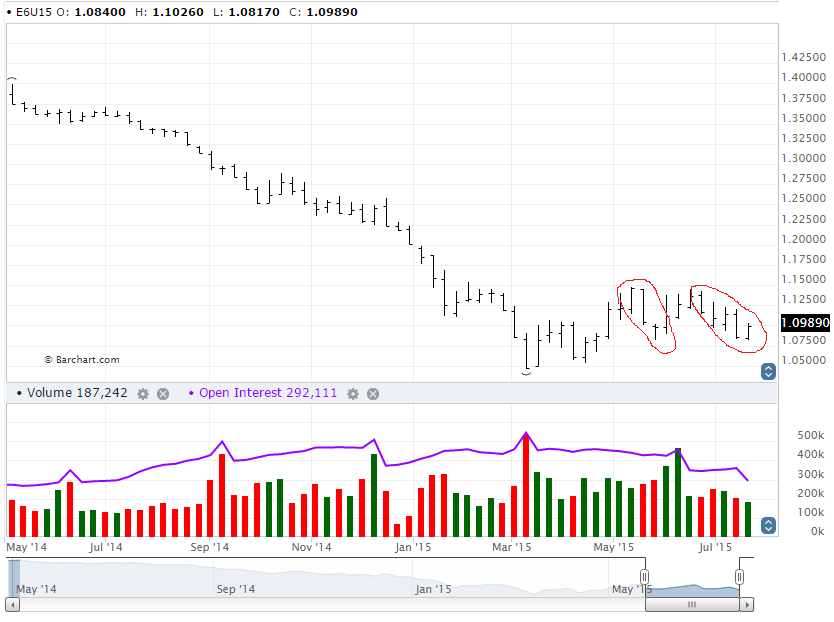
And we remember what is happening in general with the euro, and as we can see, in general, this is being redistributed, especially judging by the latest volumes of downward local trends:
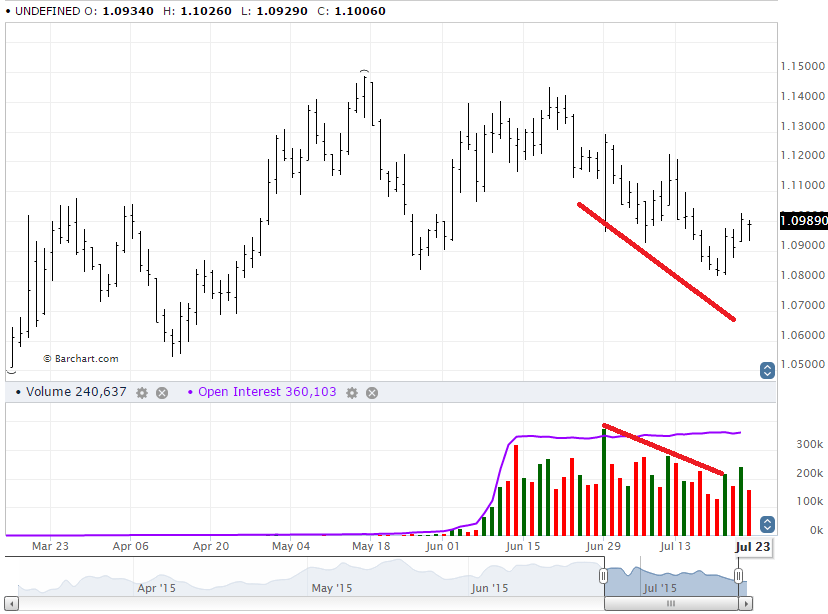
We do not notice accumulation as such, because there was no selling climax (if you look at the chart, again, before the start of the flat for the last long time). What is a sales climax by the way? This is when at the very end of the trend, at the very bottom of the chart, on high volatility and huge volumes, a large player exits the market. Therefore more on redistribution. But this is on the daily chart.
As for the weekly and higher (chart above), we see a fairly large volume there at the end of a downtrend, however, the maximum volume is subsequently on the rise, at a level that slows down the volume for buyers. And most importantly, we do not see an increase in volumes when the price falls recently. Which in general makes us think that we are redistributing.
The price is going down, volumes too, but the most important thing is that there is no volatility either, i.e. no one steals the feet of strangers, no one is taken out of the market.
If we take the lowest last pin bar, then we see that it is on a low volume, and the next couple of three bars in growth are already on medium volumes.
Well, while we are waiting for more intelligible volumes to determine the trend. Level 11500, about which I wrote, remains working, we will continue to look at the new situation.