How to Use Wall Street Trader From the Site
Big Money Activity
Very important value, which shows time and place where big money finds liquidity to open new very large positions. This places can be very strong support/resistance zones, where it is very easy to enter to the market, to a new trend or a current one.
Preparation for a trend
Speed of entering to the market of big traders. Can be a signal of big volatility in the nearest future.
New Buys / Sales Exit / New Sales / Buys Exit
Direction of huge deals. New means there were new orders on the market. Exit – that huge traders were closing their orders. For example Sales Exit means that Sell Orders were closed.
It consists of passive orders – calculated by counting volumes of new limit orders, appeared when price touches new levels.
Global Trend
Direction of largest trades on futures price for next monthes contracts including forwards and options.
Preparation for Buys / Preparation for Sales
Days, when large traders (hedge funds, big companies) enter the market. With direction of their buys and sales. (Trends for years). This indicator shows the value of deals for the nearest plans of big traders for new or current market trend.
Preparation Direction
Direction of new positions of very large traders and companies. Very important value.
If you want to trade with an indicator then read this article please.
Let’s see an example
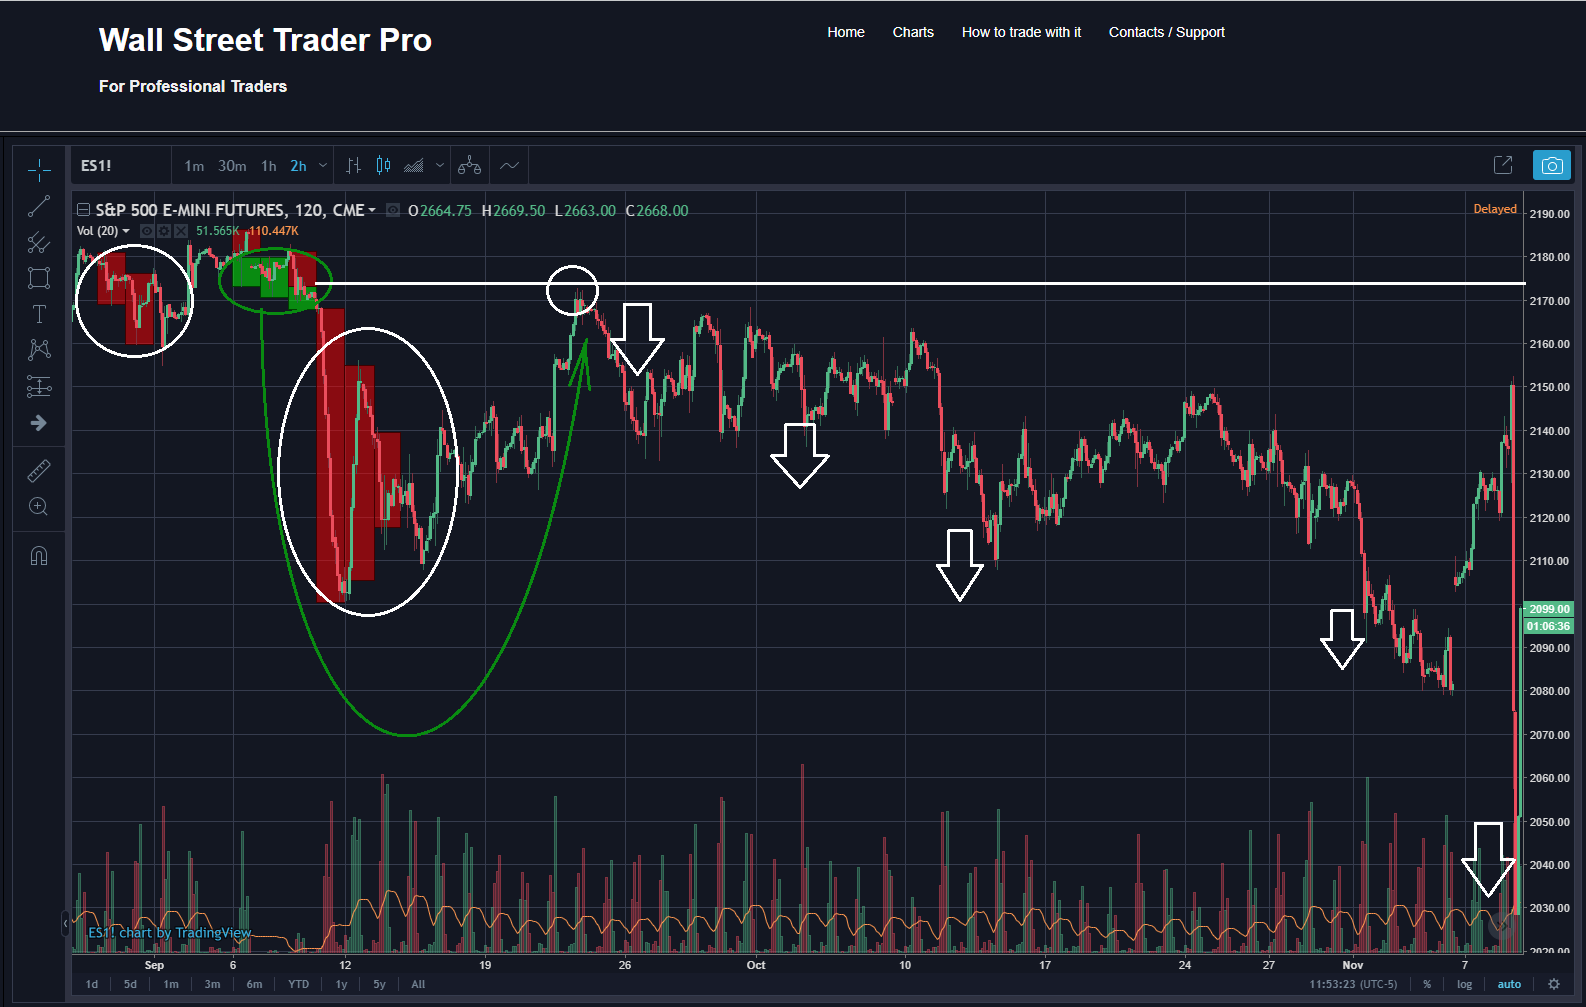
Take a look on the WallStreetTrader Pro screen. Here we can see large activity twice during two weeks:
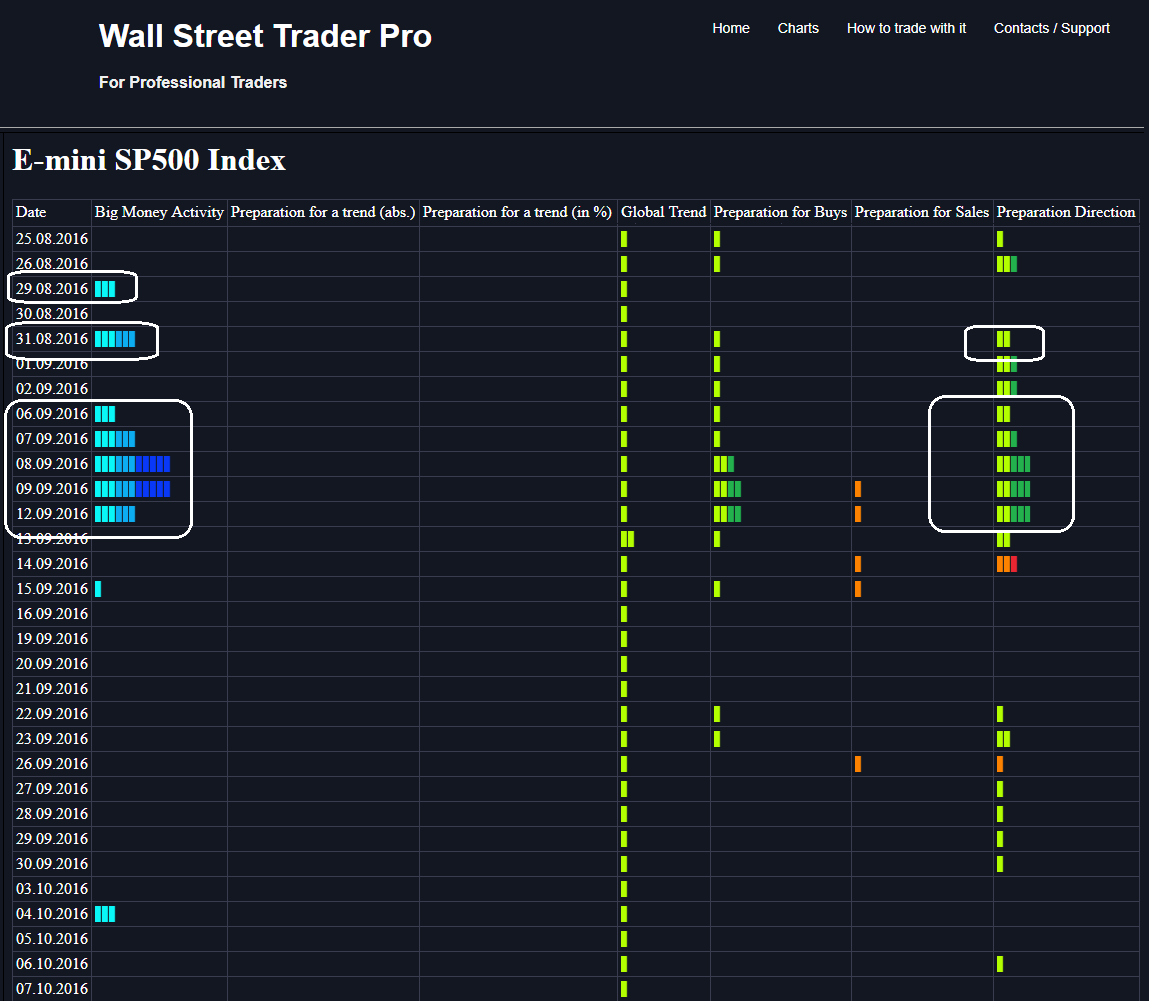
It seems that hdge funds were buying futures contracts in large volumes.
So this may be the best situation to enter the market and open a buy position.
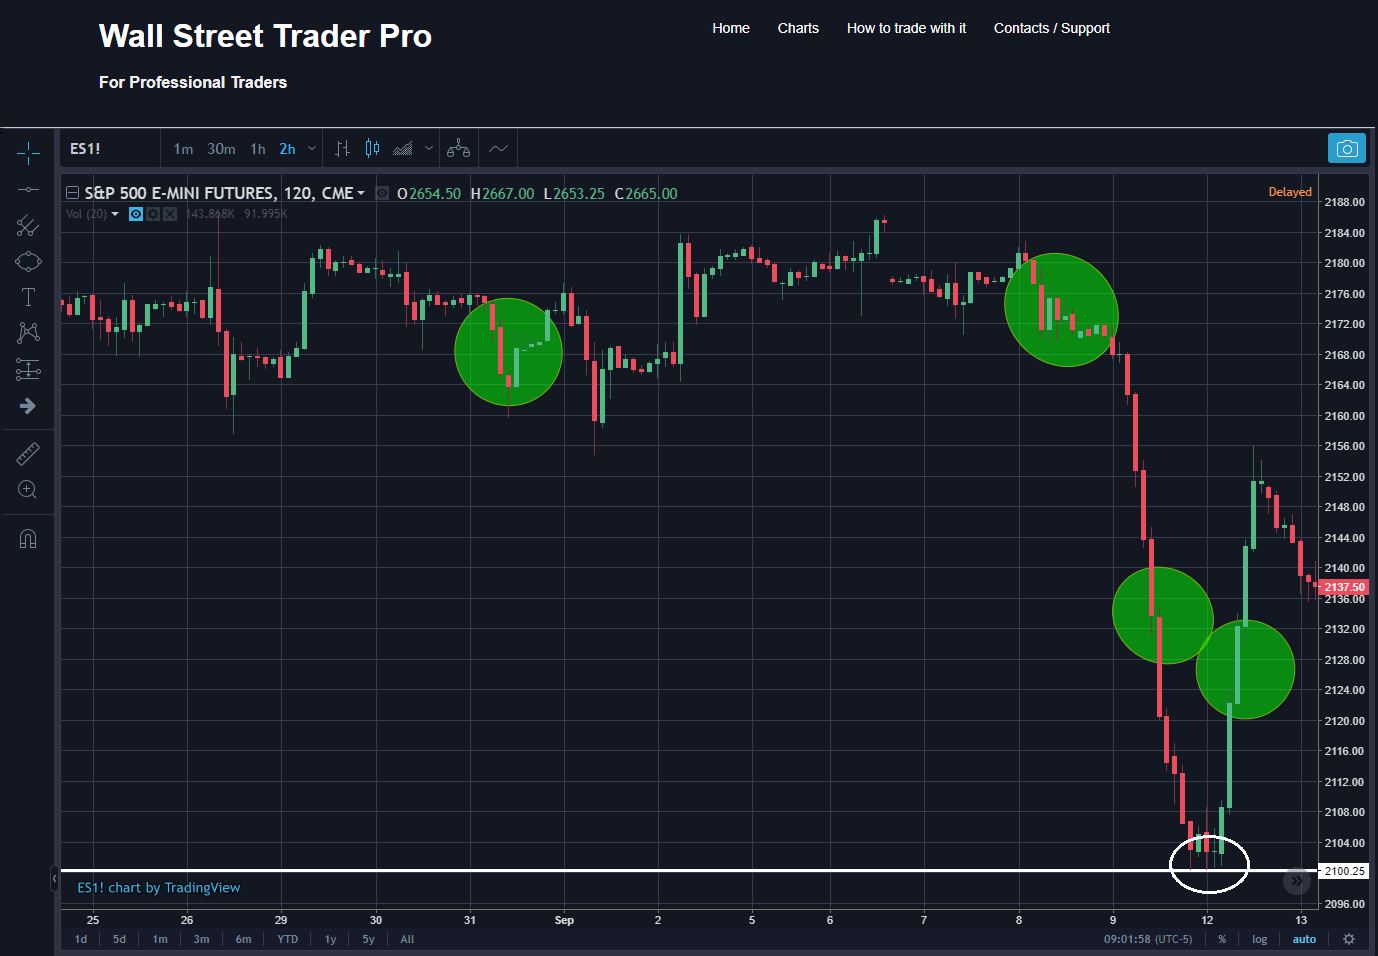
And as we see, market then went upper:
And then we see some sales, most of them were on the low levels. Why? Maybe something happened on the world?
Yes, it seems that England is preparing for Brexit now.
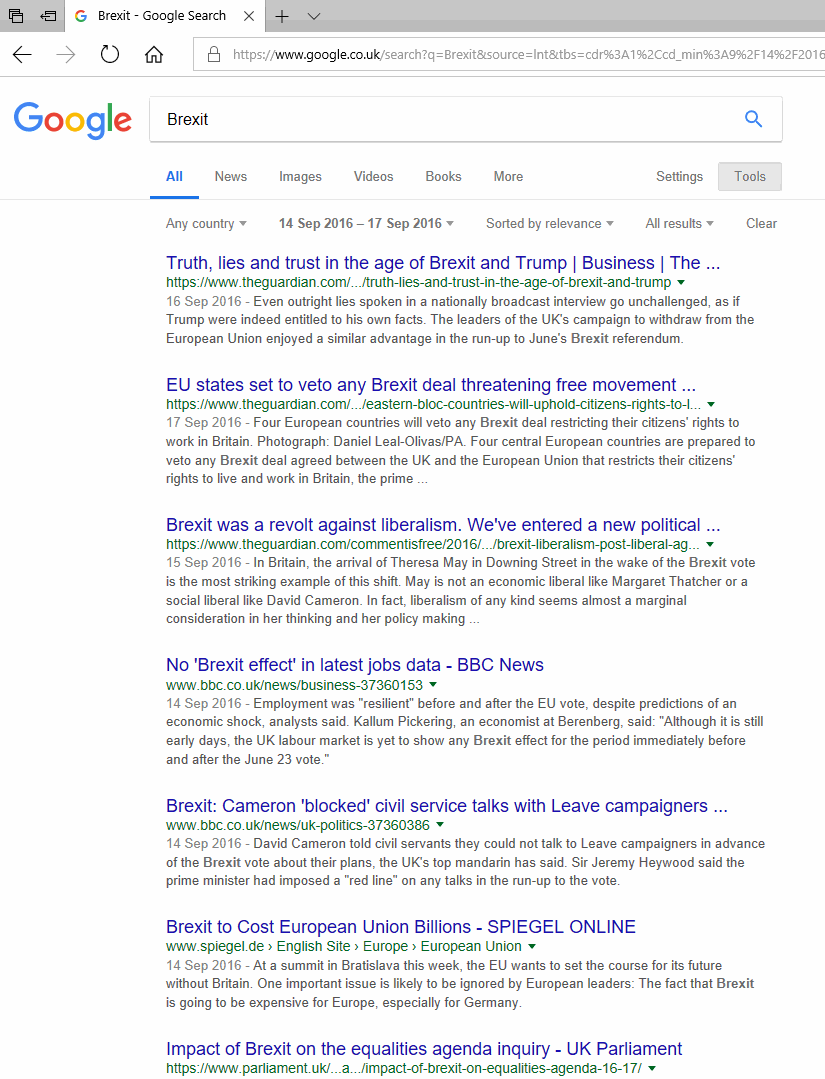
That’s why big money wants also to sell some futures. But what does it mean for us? What have: big buys and some curent sells. It seems that market should go a little lower at first, so big traders could fix their profits. And then market price could rise as it was planned before.
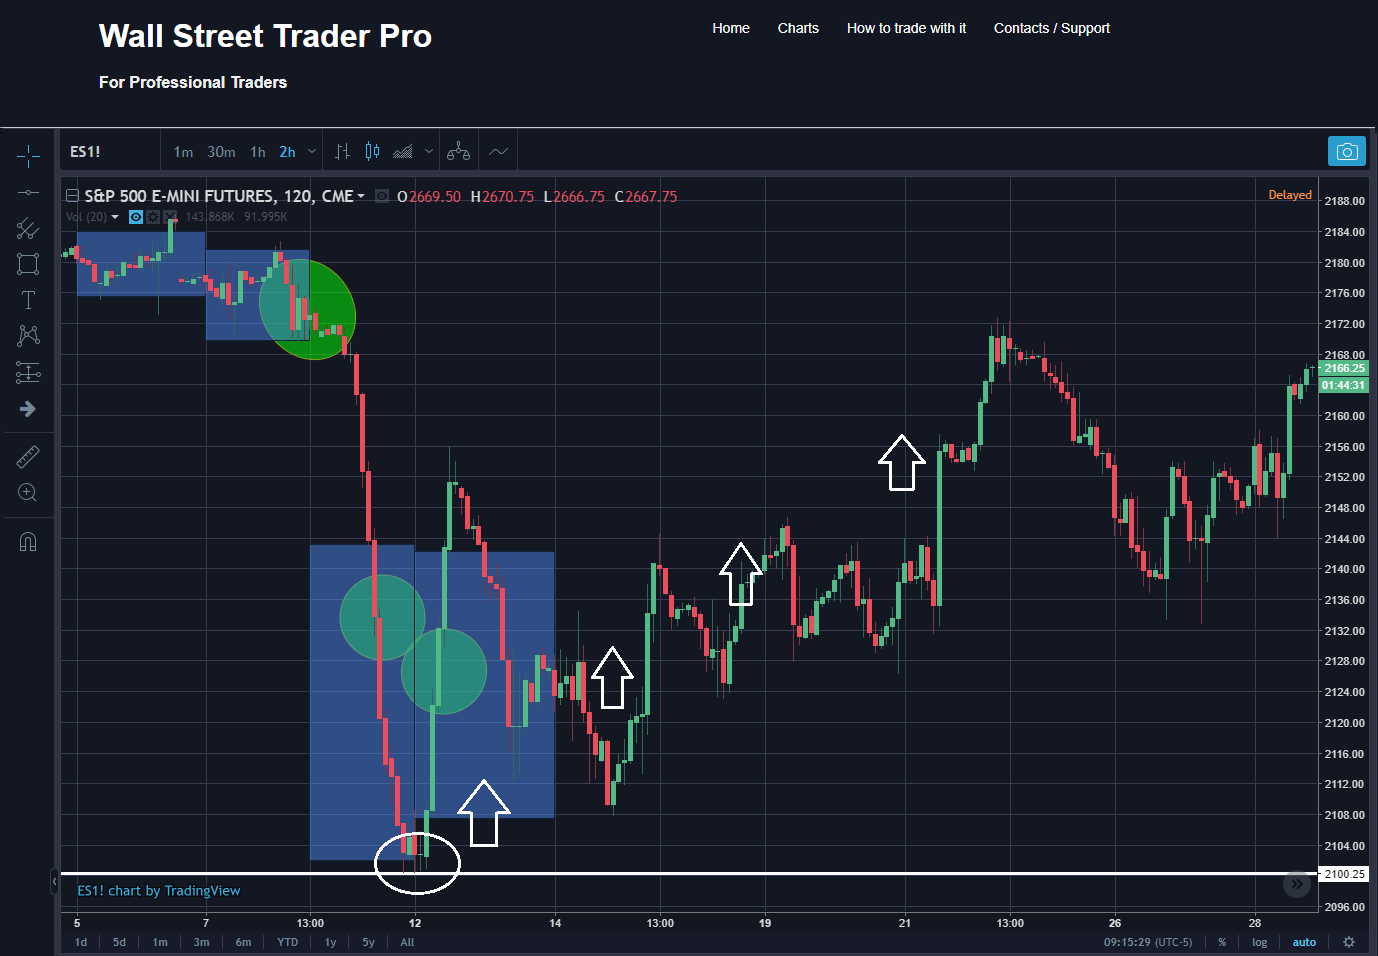
And some days later we will see additional sales.
So then this market went down and upper for the main it’s direction:
It was one of different market situations, so you can look to the WallStreetTrader data in scope of some markets to understand how it works.
Some Tips And Advices
It’s important for understanding to know that such indicators as Global Trend, Global Trend Big Activity, Preparation for Buys, Preparation for Sales, Preparation Direction shows only begining of huge money trading activity. It doesn’t mean that you should buy if you see them buying. In most cases it means that they are only started to open a new positions. And you should wait till they get large liquidity from market so they could open a really huge position. You can find such days by viewing the Big Money Activity column.
So forming a good strategy for trading it is important to find some days of large unidirectional buys or sells in the Preparation Direction column, and then to wait for good volume in the Big Money Activity column. So then you can have a day with big position of huge traders and know a direction of their trades.
Important books
If you want free educational material how to analyse markets and use wallstreettraderpro.com data then we advice you to read: http://lratrading.com/ebook
And there is also one another good trading strategy. It costs $6500. You can contact us if you want to know about it.