So, let’s do currency analysis using only Volume Spread Analysis, because it works even by itself.
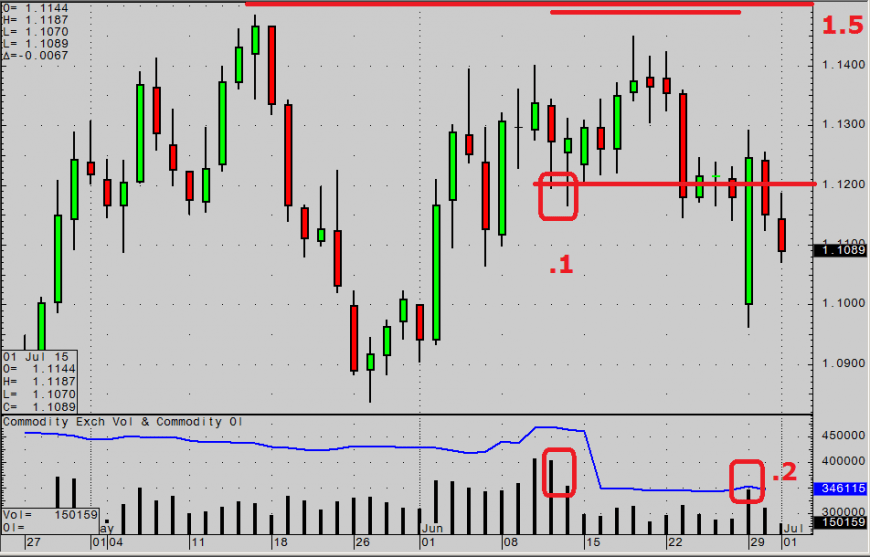
We have a redistribution of the eurodollar (if you look at the daily).
And accordingly, if we analyze the current situation, then …
As you can see, we have the last strong volumes that were at the level of 1.12 – bullish, which indicates the strength of the bulls. Point 1 on the chart.
And lately, we see a lack of demand – a key moment – when the price tries to reach the 1.5 level but fails. What speaks of the strength of bears.
So the dilemma is what to do. Usually when we see no demand – lack of demand – then if there is a trend week, you can get up on it in the sell and sit on.
But since now we see a set on the market, we need to analyze further.
At point 2 on the chart, we see an increase in volume on a bullish bar, which tells us that …. soon we will find the entry point.
I’ll write more later.
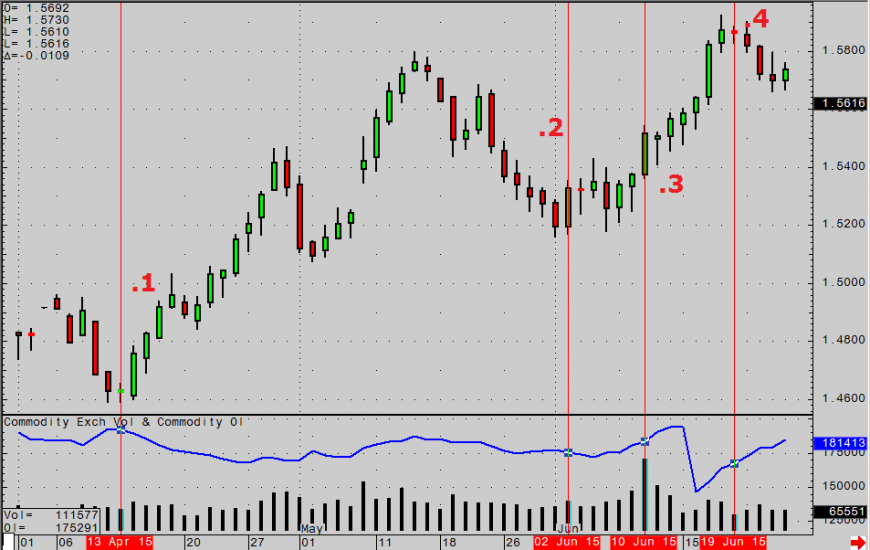
Pound analysis
Everything is much simpler here, look at the key points of the chart, and their volumes.
At 146 we don’t have an offer – an excellent indicator (point 1).
At points 2 and 3 we see bullish bars. On large volumes. According to the principle of effort-result, it is clear that these are bulls.
At point 3, level 155 is successfully broken through.
Breakout occurs on a highly volatile bullish bar with above-average volume. Then the desire of the smart to move the price up further dried up.
At point 4, we see a lack of demand, and the price falls below 1.58.
The beginning of the correction to the upward movement begins.
Everything is simple.
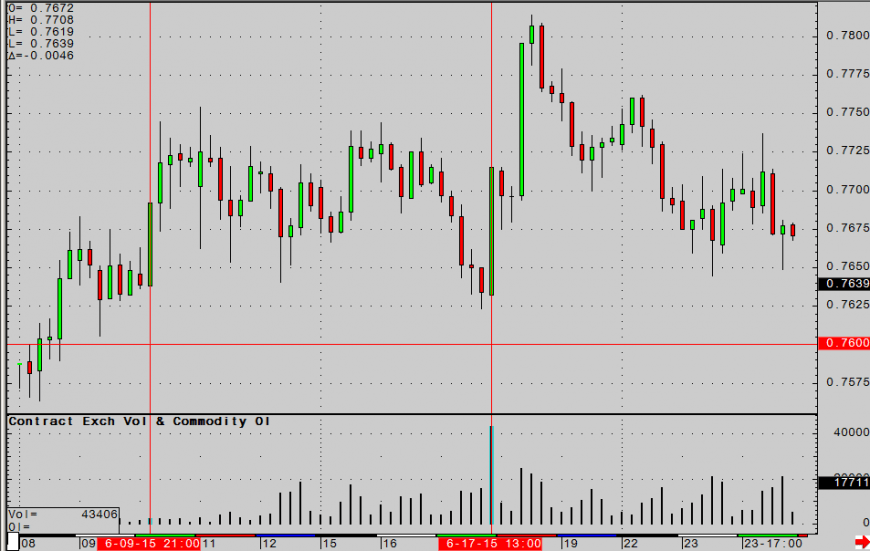
For the Australian dollar
We have a lot of flats, which looks like accumulation. And the trend is up.
But before these trends, we always have to see a selling climax to start buying. And we do not see them, which speaks so far of a continuing downtrend.
Accordingly, accumulation can easily be only redistribution.
Consider the details on a smaller timeframe:
Level 076 is drawn. We take two key points and see a buyer on them. And before that, when we first came to him, the seller was not strong enough to push through this level.
And in both cases, we see sharp rebounds to the upside, which speaks of the unsurpassed strength of the buyers.
As a result, we will go above 7820, which is the most likely and logical.
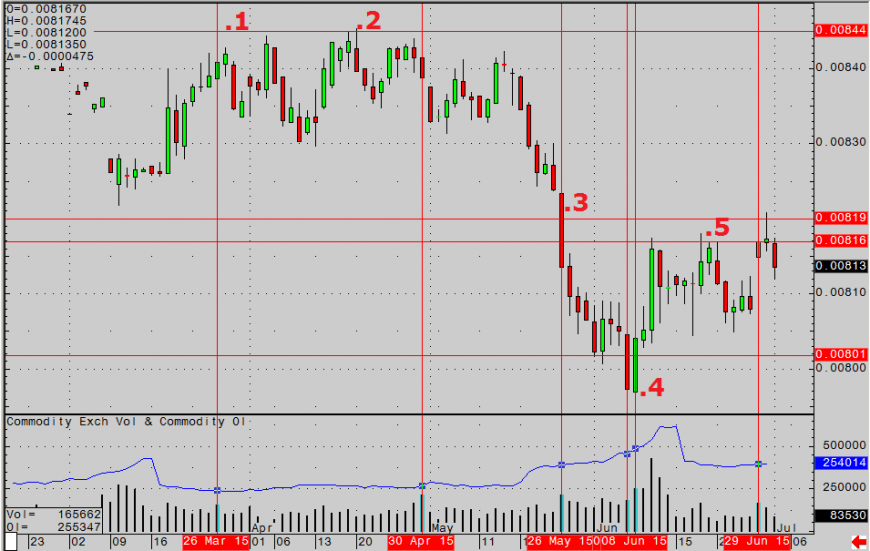
Japanese bears
Everything is simple with the yen, a stable downward trend.
1 point – upthrust 843, bullish bar on volume above average.
And then the same thing. And at point 2 the same thing. And to the right of it – and also on the volume. Moreover, on a giant one (before going down).
Then the breakdown of the level of 8200 (Point 3). Huge bearish bar on high volumes.
At point 4 at the level of 8000, we see a stopping bar with good volumes — two bars, to be exact — and then a correction.
At point 5, we see an up-thrust at the level of 8170 on volumes above average.
This means that the correction is over and we will fall again.
Everything is simple.