
I wrote this article more for trained traders. If you are a beginner, start with simple VSA books or skip straight to the examples section.
The microstructure of the Futures of FOREX market is a layer of scientific financial literature devoted to the foreign exchange market at the micro level – at the level of order execution, exchange rules for processing orders, and the price impact of transactions on the order book.
Microstructure studies topics:
- how orders affect the price,
- why the composition of the order book is changing,
- what is order flow,
- how the new order book composition predicts the price,
- what is a bid-ask spread really and why the dealer expands it on the news,
- why do slips happen?
- which orders are most capable of moving the market and why,
- why the market moves quickly without news and stands on the news,
- how the order book is formed,
- how the density of the order book affects the movement of quotes,
- what risks does high-frequency trading create,
- what order execution strategies are most suitable for large players,
and much more.
The difference between the microstructure and macroeconomic models is that it does not take into account fundamental indicators, macroeconomic indicators, news, and so on. The microstructure studies the mechanical impact of orders on quotes, studies the principles of the spread of returns, the laws and reasons why the distribution of the returns of the foreign exchange market differs from the Gaussian normal distribution model.
In simple terms, microstructure allows you to understand why markets spend more time in flats than standard patterns expect, and what causes strong price moves and crashes.
There are a great many topics, and work on them has become possible due to the fact that exchanges store more and more information about trading. Such information becomes available to researchers who build price movement models based on it, as well as models of efficient order execution – both for institutional traders and regulators.
What gives a trader a microstructure
The first thing the microstructure gives a trader is an understanding of how to start building technical systems.
Technical trading is represented by different styles. These are trend-following systems, counter-trend systems, scalping, swing trading, breakout systems. Their disadvantage is that they take the price as a starting point, as the first and main resource. But they do not take into account the principles by which the price moves.
The depth of understanding the market, the basics of pricing, understanding the behavior of large participants is the field of microstructure. It allows you to start building technical trading systems on principles deeper than price.
Initially, the appearance of this layer of information was motivated by the desire of the researchers themselves to be useful for institutional traders. As a result, many scientists who study the microstructure of the market become staff or advisors in hedge funds or work in structures that regulate the markets. Great motivation to follow their work.
Volume Spread Analysis (VSA) and VSA 2.0
We applied the layer of knowledge from the microstructure to the Volume Spread Analysis (VSA) method and as a result we got VSA 2.0.
To understand this method, I recommend reading books on VSA. it contains at least many different patterns that you need to learn everything in order to understand what is happening in the market at one time or another. For example, there is such a formation 1-2-3.
Example 1
Here is an example. I must say right away that I’m sorry for the poor quality of some of the photos, I took them a long time ago, when I was still learning to trade using the VSA method.
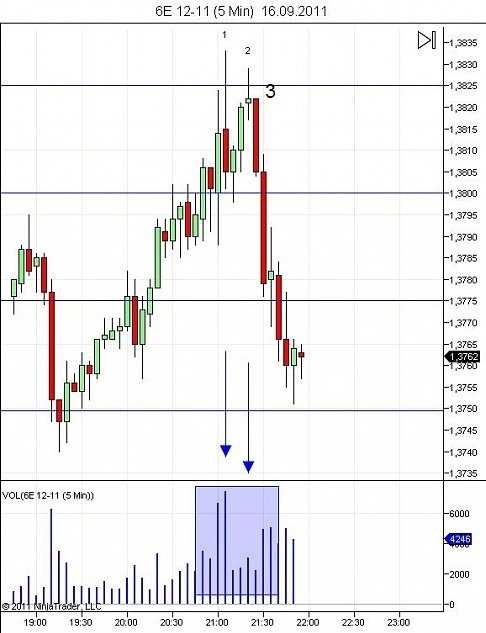
If the second shoulder is lower than the first and the volumes are lower, then you can sell at point three.
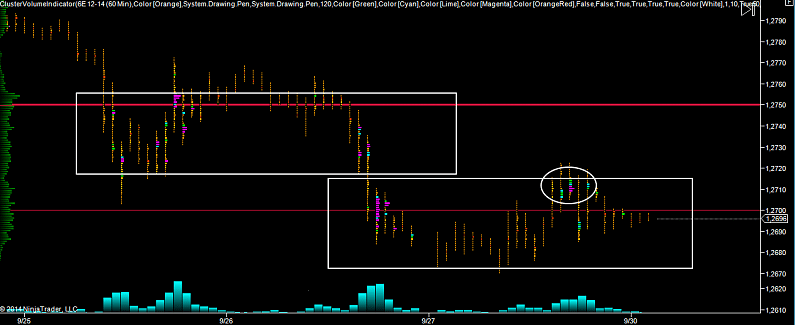
Example 2
Here is a beautiful example when selling volumes appear on the border of a broken sales range – you can add sell:
Example 3
Now look at this picture from 10.25.2014:
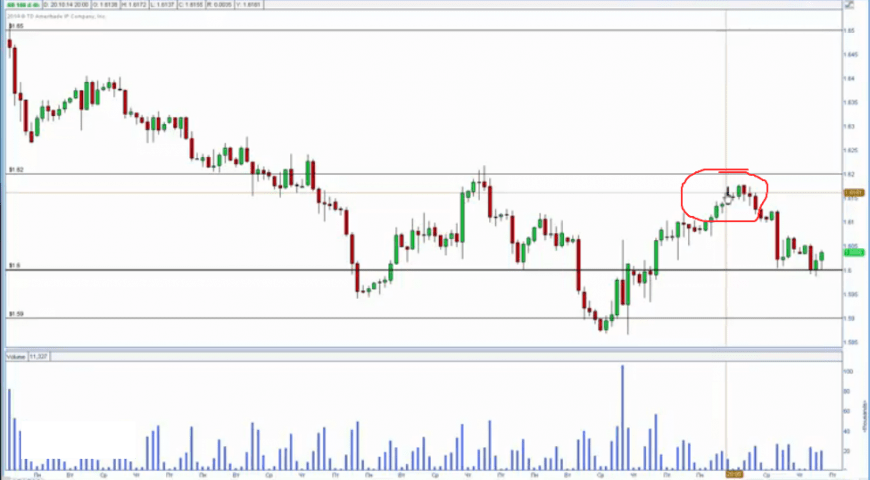
An example of a long-term analysis with GBPUSD is generally simple here, the demand is zero, the sale is complete:
One-two volumes
Volatility!!!
Volume low
Range low
It’s on a downtrend
The trend is clearly down.
I also want to attach a picture of the volumes of dealers and ordinary mortals – below is a picture of the volumes of dealers:
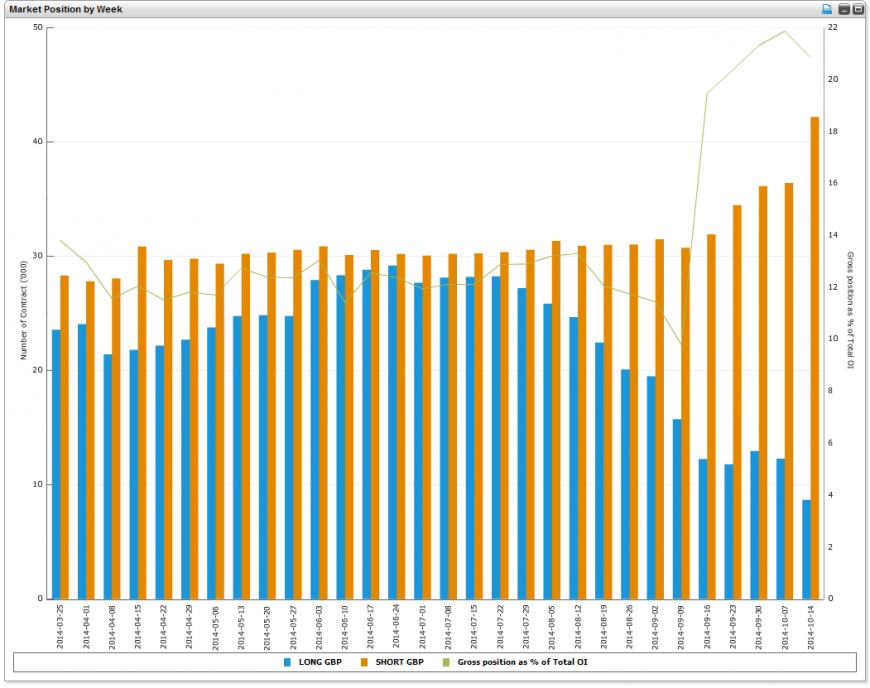
As you can see, sales are only increasing, so the current prices are only the beginning of the next fall, and not a trade up!
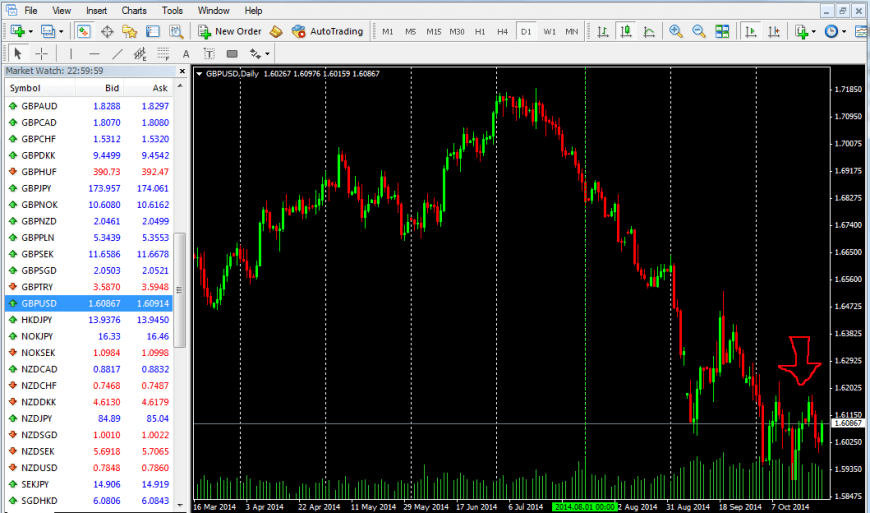
About the news background.
Look at the statistics: UK economic growth data for the third quarter was in line with market forecasts, but due to the Ebola virus and the threat of its consequences, pressure on the pair will be strong.
See also how strong the dollar index is growing.
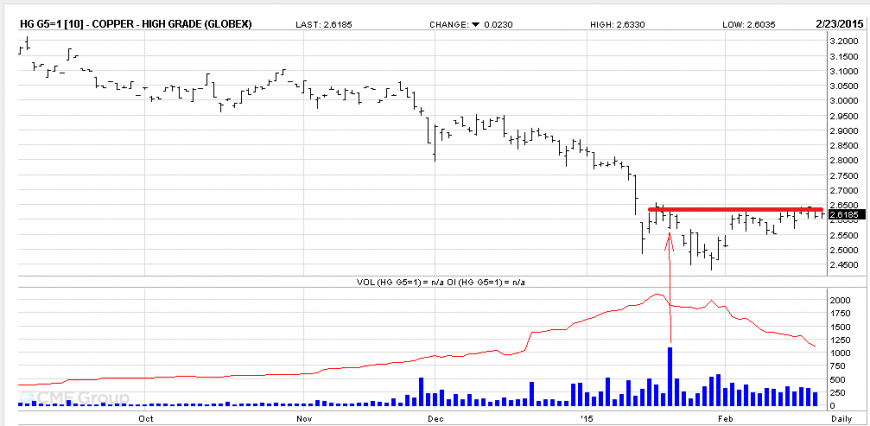
Example 4
Example with Copper – very easy:
Example 5
Example with Eur/Usd:
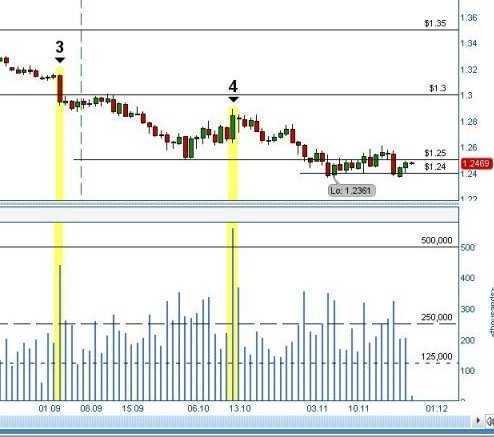
Point 3 – the volume of the fall on an unrealistically huge volatility + volume, where they passed and fixed under the price of 130,000 (critical level).
Point 4 – upthrust, buyers bar on strong will and mega volume. Those. buyers pushed, gave birth, And but failed to give birth. So we go to hell.
Conclusion: We are falling down and we will fall for a long time!
Example 6
As we can see from the picture, we have no demand for the euro in general. From 11 of July 2015.
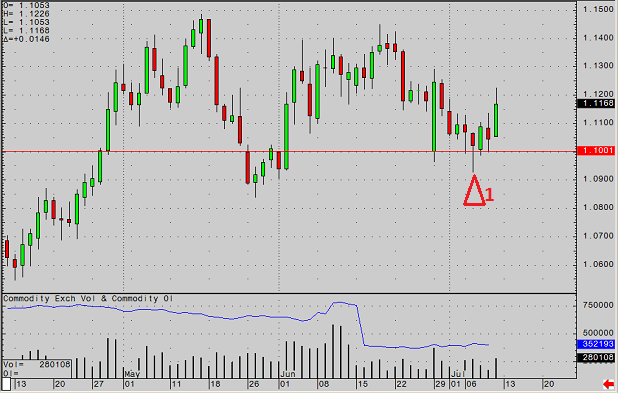
Bullish pin (bullish negation) on volume, strictly at 1.1000 (indicated by triangle number 1). The shadow of the bar is exactly on the border with the level.
Applying the effort-result principle, it can be seen that the July 7 bulls failed to take the price far from the 1.1000 level and the market falls not on the volume of sellers, but rather on the lack of demand from buyers. The only buyer (strong) that exists is sitting and defending the 1.100 level, but at the same time, his strength is limited, as the chart shows.
In the medium and long term, the trend turns out to be decreasing, although small upward corrections are possible, in view of some buyer.
Other Examples
Other Live Examples of How to Analyze the Market Using the VSA Method
- Analysis of Eur/Usd
- Not the easiest case of analysis
- Simple Analysis
- Another examples based on VSA
- Another futures trading strategies based on volume analysis
VSA Book
And also download a pdf book about the basics of VSA analysis.
Download Volume Spread Analysis Fundamentals.