If you want to be profitable, trade VSA. So says the ancient proverb.
To begin with, we need the largest volumes in order to find exactly the strongest levels.
Here’s an example for oil:
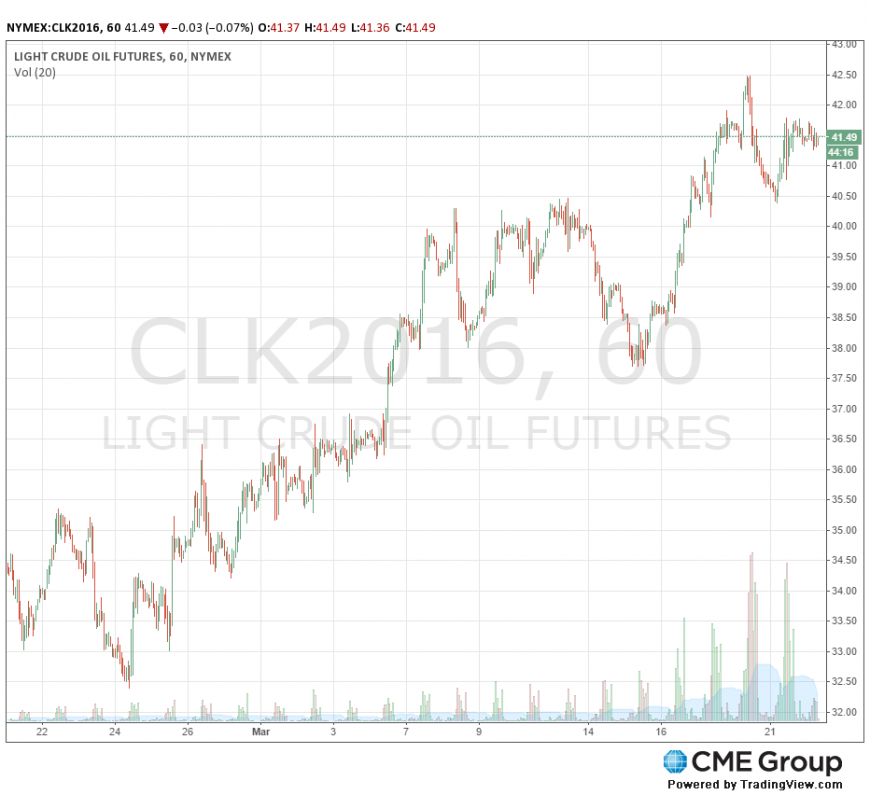
If we mark on the chart the levels that they protect, we get the level of sales.
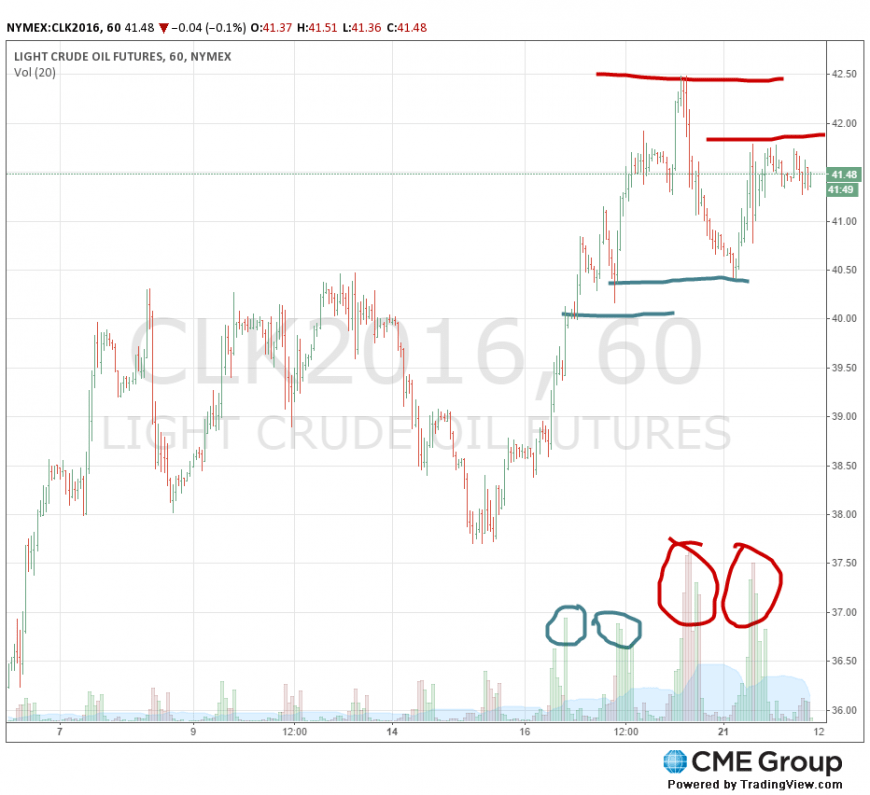
From the bottom, you can not take the volumes of purchases, they are smaller, but in general they will show us the first target for sales.
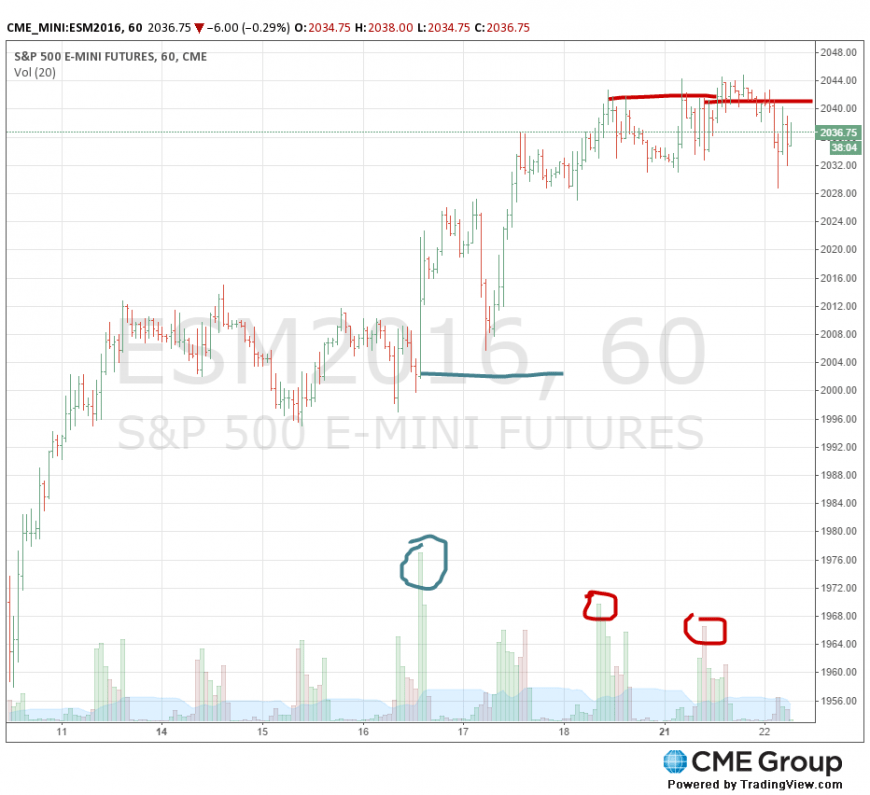
Next, we will analyze the SIPI since it is being so actively discussed here.
Here we also have sales so far, so there may be a correction
Next, we look at gold, where sales triangles are drawn according to technical analysis. However, in fact we only have purchases.
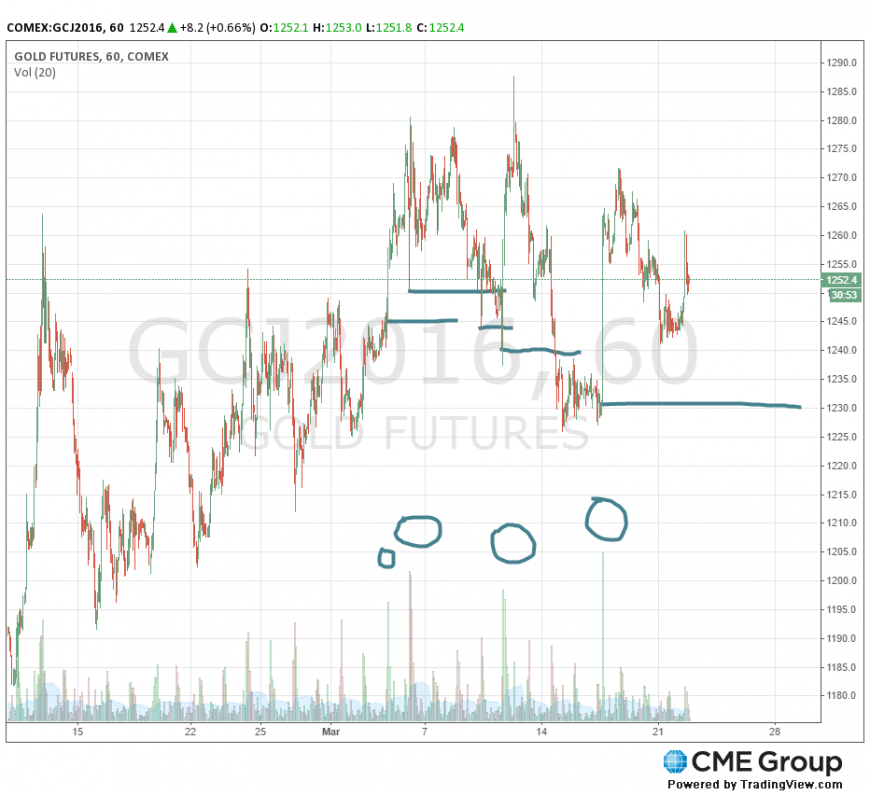
Read also about the basic concepts of the Volume Spread Analysis analysis method.