
Having been in the market since 2007, I have tried many trading systems, so I want to share with you those that work well, and also those that are not worth wasting time on. And I suggest starting with the top trading strategies based on the volumes analysis practices. If you are a beginner, you can start with them too. But if it seems complicated to you, then go to the section below. And I want to start first of all with what I use myself, which has proven itself over the years.
Trading Strategies Based on Volume Analysis
Trading Strategy Based on WallStreetTrader Volumes Indicator
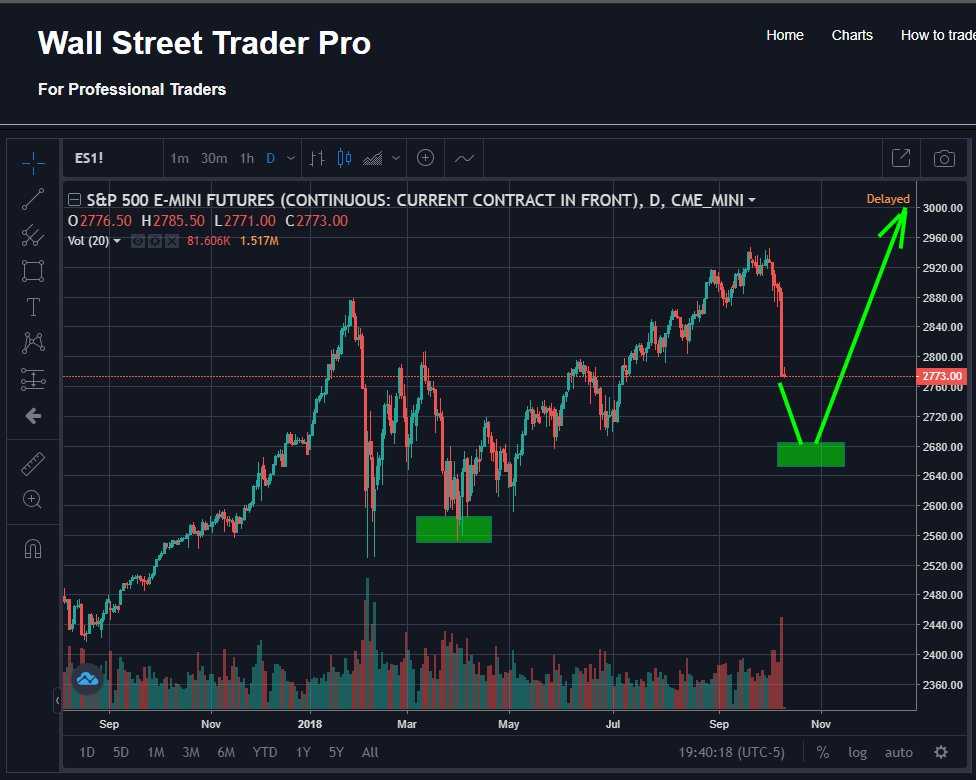
How to Trade with Futures Indicator WallStreetTrader
This is my main strategy. I see the market according to this concept: the price in the market can be arbitrarily the same, if the state of the economy does not change more or less. For example, oil costs $100 per barrel. Buyers buy, manufacturers sell. Why is the price like this? Because somehow there is a balance between supply and demand.
However, there are speculators in the market. Those who buy oil in order to sell it before delivery. There are also hedge funds that are essentially big speculators. There are dealers. There are market makers. And it is precisely because of these categories of people that the price changes. If speculators buy a lot of oil, then it makes sense for a major player to push the price down and collect speculators’ money.
There is a currency market, where the price reflects, albeit belatedly, but the approximate demand for currencies. If someone needs a lot of one currency, then buying it from the market in large quantities, supply and demand will change. This is the same as in oil, but there the productivity of goods changes more slowly than the demand for currency in certain countries changes. But otherwise, everything is identical.
So, if we find places on the chart where a lot of small fish gather in a bunch, which believe in one religion (trend direction), then it is obvious that a large fish will eat all this trifle. It does not matter how she eats it – slowly rocking the boat up and down a little, so as not to scare speculators and cause them to exit the market prematurely, or vice versa, a lightning-fast sideways move to collect people’s margins as soon as possible. It all depends on what the big fish sees in the order book level2.
I do this with the wallstreettraderpro.com platform and VSA analysis. And I also use the base of technical analysis in order to find the best entry levels. This is my basic strategy, which I share, and here I will post statistics on it. On my main large accounts, I have an extended strategy, and I teach it for a fee.
SOT. Many do not like SOT, because. they are late. This is true and therefore WST + VSA is sufficient for most cases. But if the trend is being prepared for six months or a year in advance, then the SOT will help establish the correctness of the chosen direction. It will also help to determine in advance in long trends when a large fish is eating up the last fish.
Technical analysis is needed in order to find the best entry points. If I understand that a major player has bought a dollar, then in order to enter a sell on the eurodollar, I’d better look for some significant level near the sale of larges to enter from it.
My strategy is simple, and I hope that I will find like-minded people. The simplicity of the strategy guarantees reliability.
Read more about this strategy with examples and trading statements…
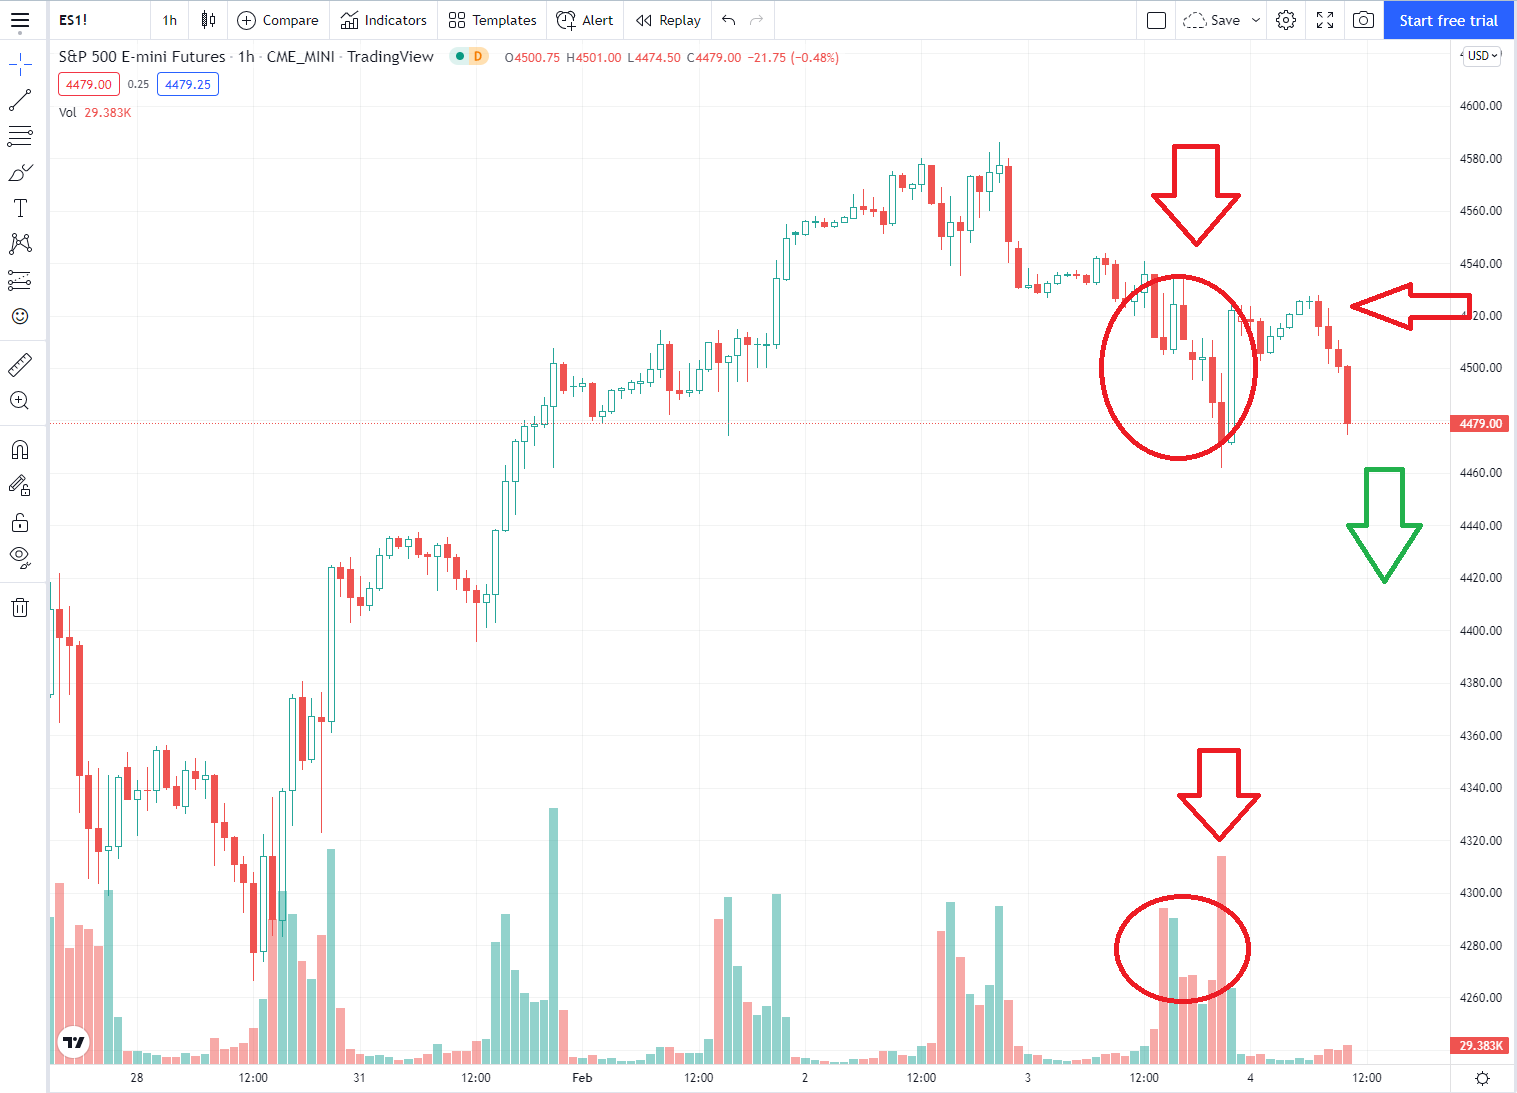
Volume Spread Analysis
Volume Analysis (also referred to as price–volume trend and volume oscillators) is an example of a type of technical analysis that examines the volume of traded securities to confirm and predict price trends. Volume is a measure of the number of shares of an asset (such as a stock or bond) that are traded in a given period of time. As one of the oldest market indicators used for analysis, sudden changes in volume are often the result of news-related events. Commonly used by chartists and technical analysts, volume analysis is centered on the following ideas:
When the volume of a security is increasing or at a relative peak, the current trend in price is confirmed and is said to have momentum
When the volume of a security is decreasing or at a relative minimum, the current trend in price is fragile and is said to lack momentum
Where to read about it?
- You can learn more about this strategy from the video below, and also by reading the detailed description of our strategy on the page with VSA.
- We also have a dedicated section dedicated to trading and analysis with VSA.
- And besides this, you can download our pdf file with the trading philosophy of the Volume Spread Analysis method as a whole.
Good Videos (Must See) on Quality Futures Trading Strategies
The Most Popular Strategies Today
Really good selection of methods of market analysis.
The Most Top Strategies
I also really like this video, it was created by a person from the CME Group exchange, who has a lot of trading experience.