As we can see from the picture, we have no demand for the euro in general.
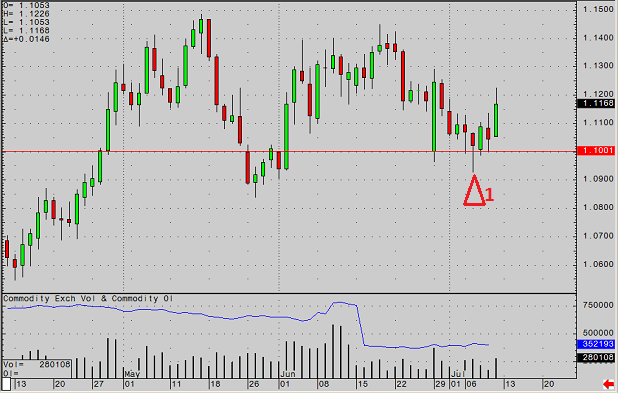
Bullish pin (bullish negation) on volume, strictly at 1.1000 (indicated by triangle number 1). The shadow of the bar is exactly on the border with the level.
Applying the effort-result principle, it can be seen that the July 7 bulls failed to take the price far from the 1.1000 level and the market falls not on the volume of sellers, but rather on the lack of demand from buyers. The only buyer (strong) that exists is sitting and defending the 1.100 level, but at the same time, his strength is limited, as the chart shows.
In the medium and long term, the trend turns out to be decreasing, although small upward corrections are possible, in view of some buyer.